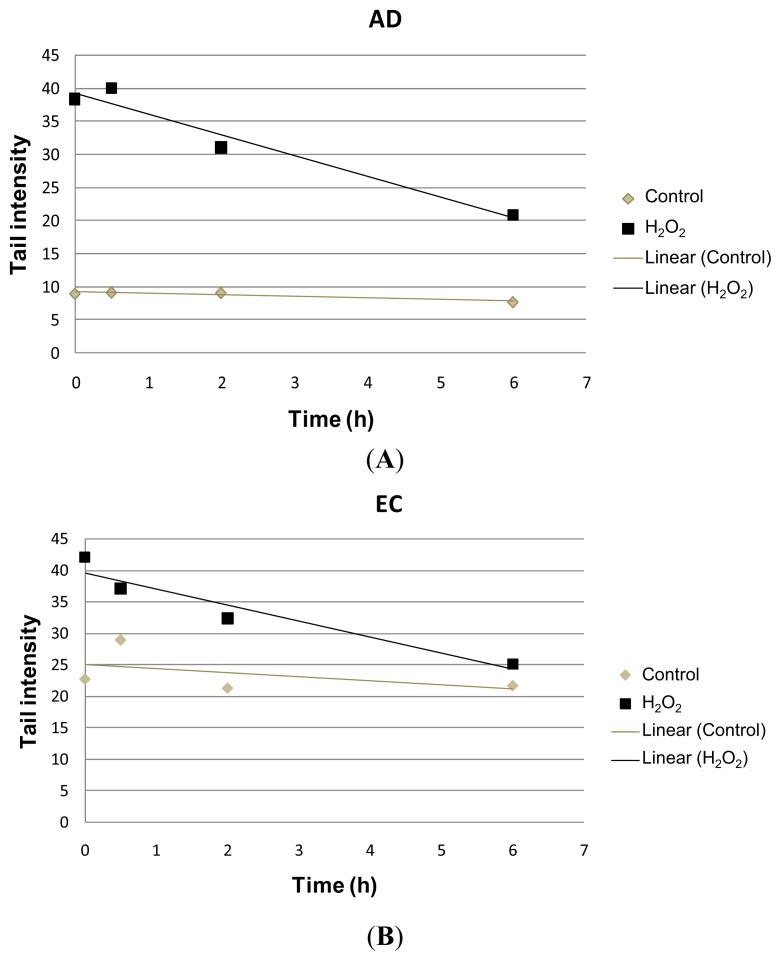
Figure 2.
Scatter plots with mean values of tail intensities as a function of time obtained in lymphocyte cultures of AD patients (R2 = 0.9564) treated with H2O2 and the respective EC group (R2 = 0.9178), as analyzed by linear regression. Time-dependent repair kinetics (decrease in the values of tail intensities) displayed by lymphocytes of (A) AD patients and (B) EC individuals treated in culture with H2O2.

