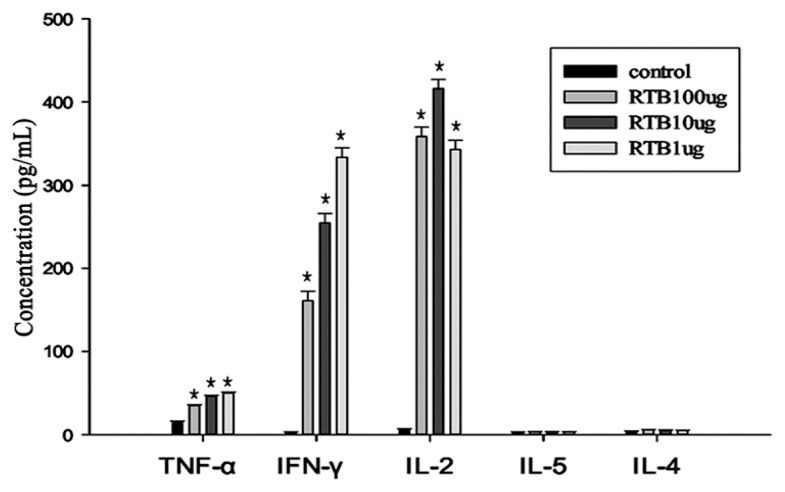
Figure 6.
Expression of TNF-α, IFN-γ, IL-2, IL-4 and IL-5 in spleen cells from mice with different concentration of RTB through cytometric bead array immunoassay (CBA) analysis. Splenocytes were stimulated with RTB (1, 10 and 100 μg/mL) in the presence of 2.5 μg/mL ConA for 48 h. The culture supernatants were collected and assessed for cytokine production (TNF-α, IFN-γ, IL-2, IL-5, IL-4) by CBA analysis. Data are presented as the means ± SD of three replicates. *p < 0.01 compared to the control group.

