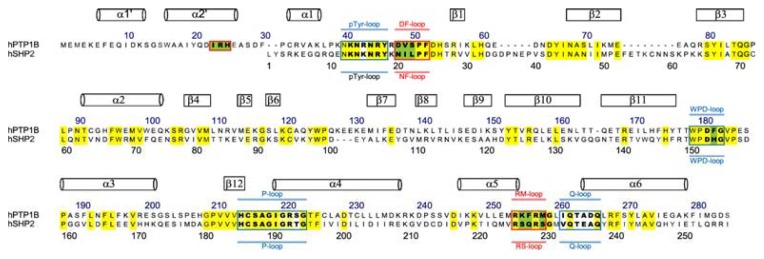
Figure 5.
Sequence alignment of PTP domains between PTP1B and Src homology 2 (SH2) domain-containing phosphatase 2 (SHP-2). The catalytic site and site B regions are boxed with blue and red lines, respectively. In this article, single letters with yellow and green squares indicate the conserved residues and non-conserved residues involved in the definition of substrate selectivity-determining regions. Residue numbers for PTP1B and SHP-2 are shown above and below the alignment, respectively.

