Fig. 5.
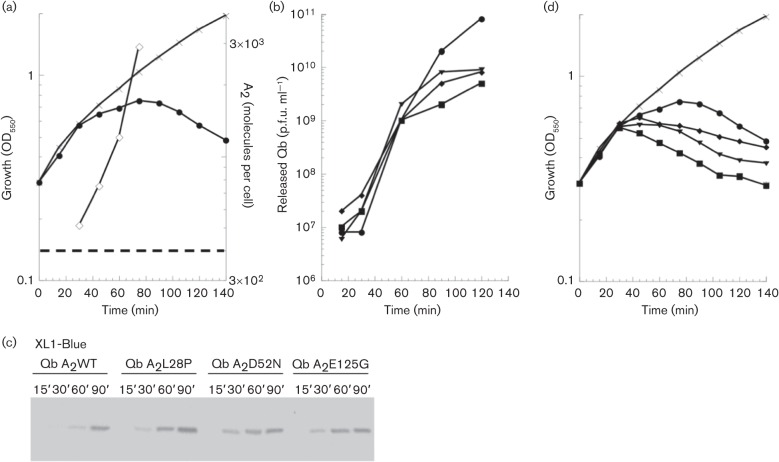
Qβ and Qβ por phenotype of infected cells. (a) Infection of XL1-Blue cells with Qβ. Reduction in cellular mass accumulation is observed starting at 30 min with a maximum at 80 min with phage input m.o.i. of 1. A2 accumulation (◊) was quantified at intervals during infection. The dashed line represents the number of MurA molecules in XL1-Blue. (b) Qβ has a higher released p.f.u. titre after a single infection cycle than Qβ por. (c) A2 accumulation during infection of XL1-Blue. Loading was normalized to total volume. Samples were taken at the time points listed (min). (d) Qβ por mutants have an earlier lysis phenotype in XL1-Blue-infected cells. Qβ infection (a) reproduced with Qβ por infections. Qβ-only control (×), Qβ A2WT (•), Qβ A2L28P (⧫), Qβ A2D52N (▪) and Qβ A2E125G (▾).

