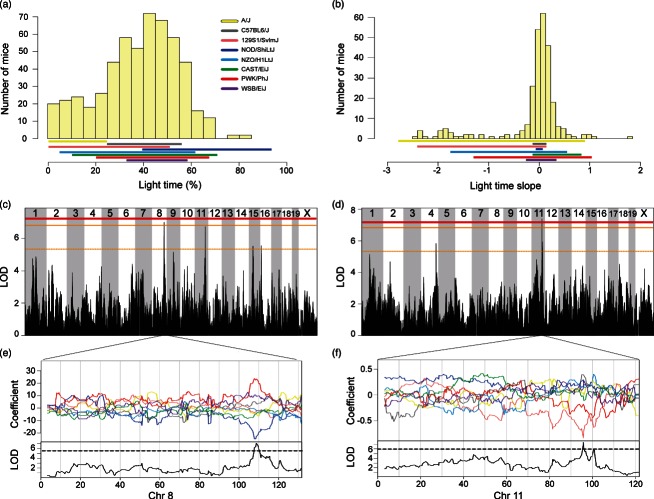
Figure 2. Significant genome-wide QTL for behaviors in the light–dark box.
Phenotypic distributions of DO mice for (a) percent time spent in the light and (b) time spent in the light slope. Solid colored bar below histograms represent phenotype ranges (min–max) of each progenitor strain. Significant genome-wide QTL for (c) percent time spent in the light and (d) time spent in the light slope. Horizontal lines represent permuted significance thresholds as follows, solid red line (significant, P < 0.05), solid (highly suggestive, P < 0.10) and dashed orange lines (suggestive, P < 0.63). Allelic effect plots of eight coefficients of the QTL mixed model representing the effect of each founder haplotype on phenotype. (e) An increasor PWK/PhJ allele and a decreasor NOD/ShiLtJ on Chromosome 8 was associated with time spent in the light. (f) The 129S1/SvlmJ allele on Chromosome 11 was associated with a decreased amount of time spent in the light side over the testing session. Dashed line is the maximum LOD −1.5, defining the 95% support interval of the QTL.

