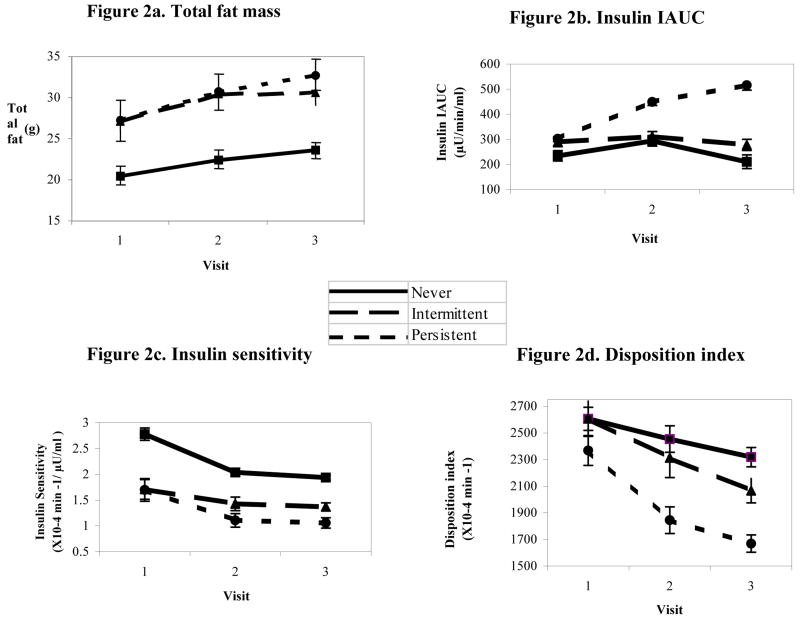
Figure 2.
Changes in fat mass and insulin/glucose indices over 3 annual visits by metabolic syndrome group in overweight Latino children
Figure 2, A: Total fat mass (n=71). Effect of time: p=0.066; Differences by group: omnibus p=0.106, N vs P p=0.039; Interaction for time by group p=0.024. Figure 2, B: Insulin IAUC (n=69). Effect of time: p=0.025; Differences by group: omnibus p=0.025, N vs. P p=0.012, I vs. P p=0.018; Interaction for time by group p=0.012. Figure 2, C: Insulin sensitivity (n=68). Effect of time: p=0.001; Differences by group: omnibus p=0.019, N vs. P p=0.006, N vs. I p=0.073; Interaction for time by group p=0.872. Figure 2, D: Disposition index (n=68) Effect of time: p=0.419; Differences by group: omnibus p=0.044, N vs. P p=0.020, I vs P p=0.024; Interaction for time by group: p=0.482.

