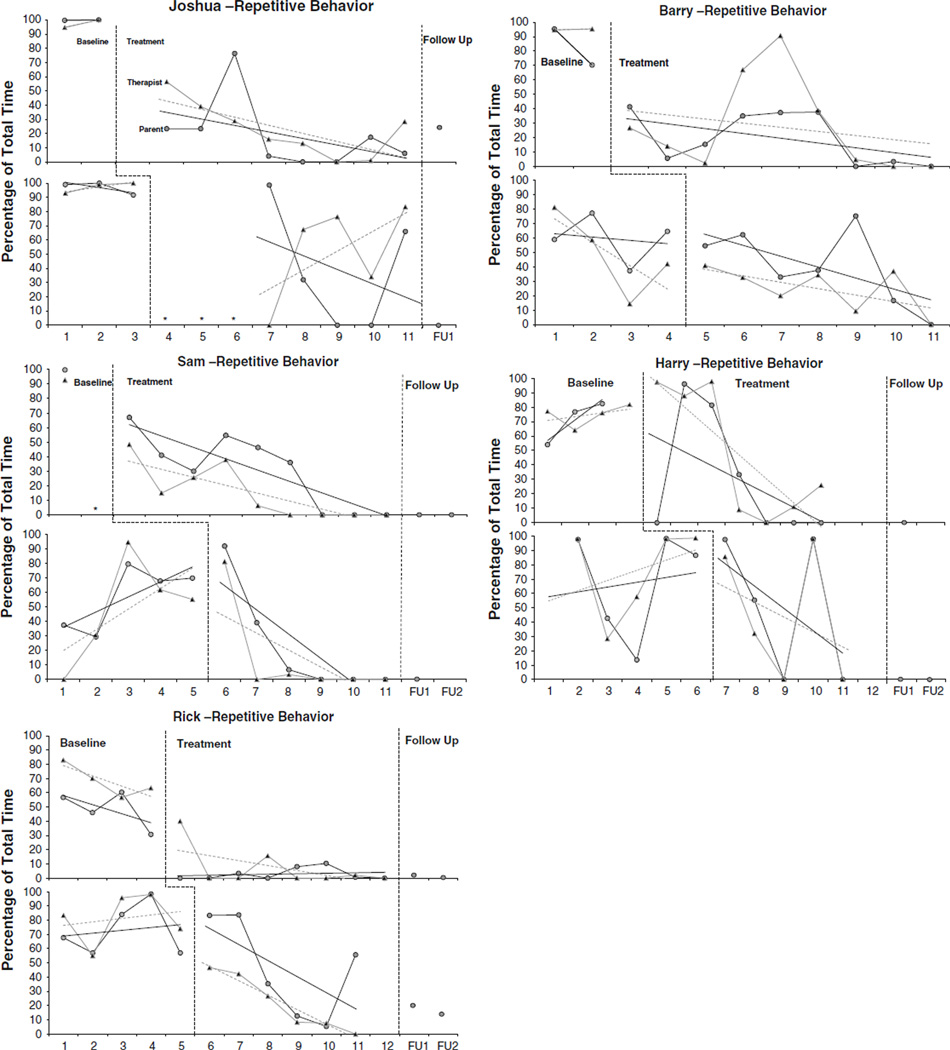
Fig. 1.
Child engagement in repetitive behavior. The graphs reflect the percentage of time the child engaged in repetitive behavior during the session. The dashed lines reflect data trend lines for the therapist and the solid lines reflect trend lines for the parent. In baseline sessions with only 2–3 data points, the trend lines directly overlap the lines for the actual data. Note. The asterisk indicates we were unable to collect data during a particular session, which primarily occurred because of child noncompliance

