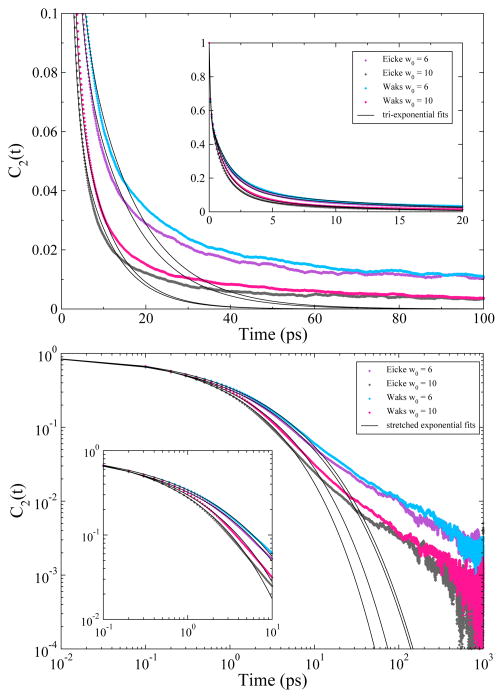
Figure 4.
Rotational anisotropy decay auto-correlation functions for the unrestrained CHARMM reverse micelles. The inset plots show that the auto-correlation functions fit well to a tri-exponential function (top) or a stretched exponential function (bottom) up to approximately 10 or 20 ps. The large plots show that these fits fails to describe the correlation functions on longer time scales.

