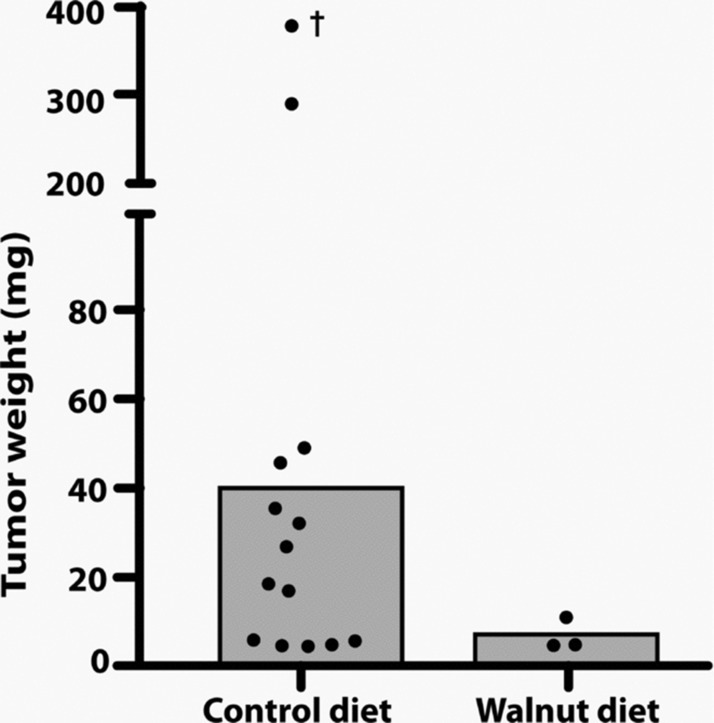
Figure 4 .
This figure depicts the final tumor weights in the control-fed and walnut-fed animals at the conclusion of the study. The value identified with a † was estimated and was not used to calculate the mean tumor weight; it was found in a mouse that had been dead for a number of hours. The histograms indicate the mean tumor weights. As with the tumor volume, because of the small number of tumors that grew in the walnut fed mice (three each) and due to the large variation in tumor size, the median tumor weights did not differ between the groups when tested using either the Mann–Whitney U or Kruskal–Wallis tests.

