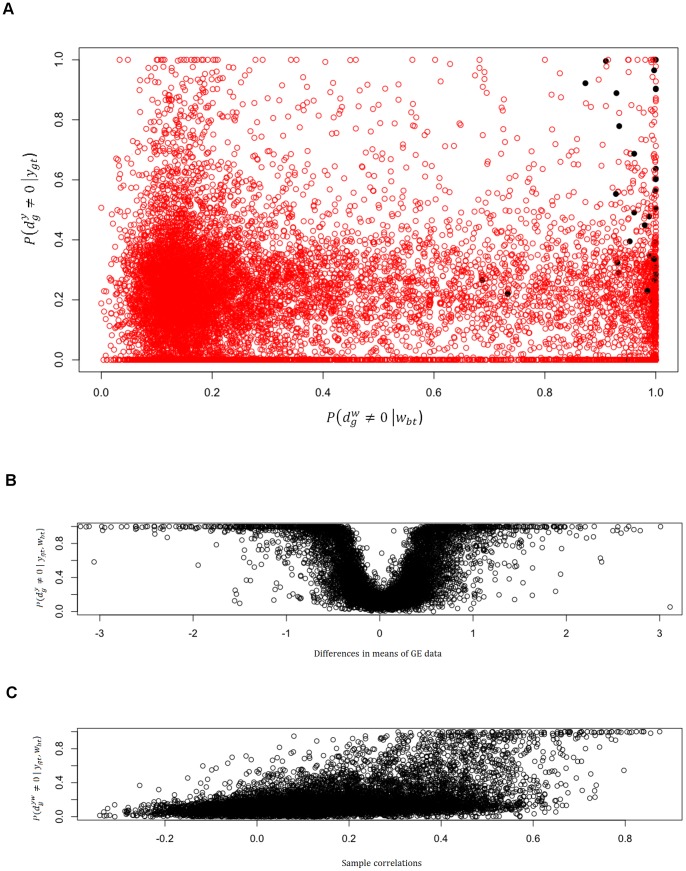
Figure 3. Posterior probabilities of differential CNA (on the x-axis) and differential expression (y-axis) obtained respectively through the marginal models on CNA data and gene expression data (A).
Black dots highlight posterior probabilities of genes which are claimed by the model to show joint differential behaviour (A). Comparison between differences in means of the gene expression data and posterior probability of differential expression (B). Comparison between sample correlations and posterior probabilities of positive interaction between platforms (C).

