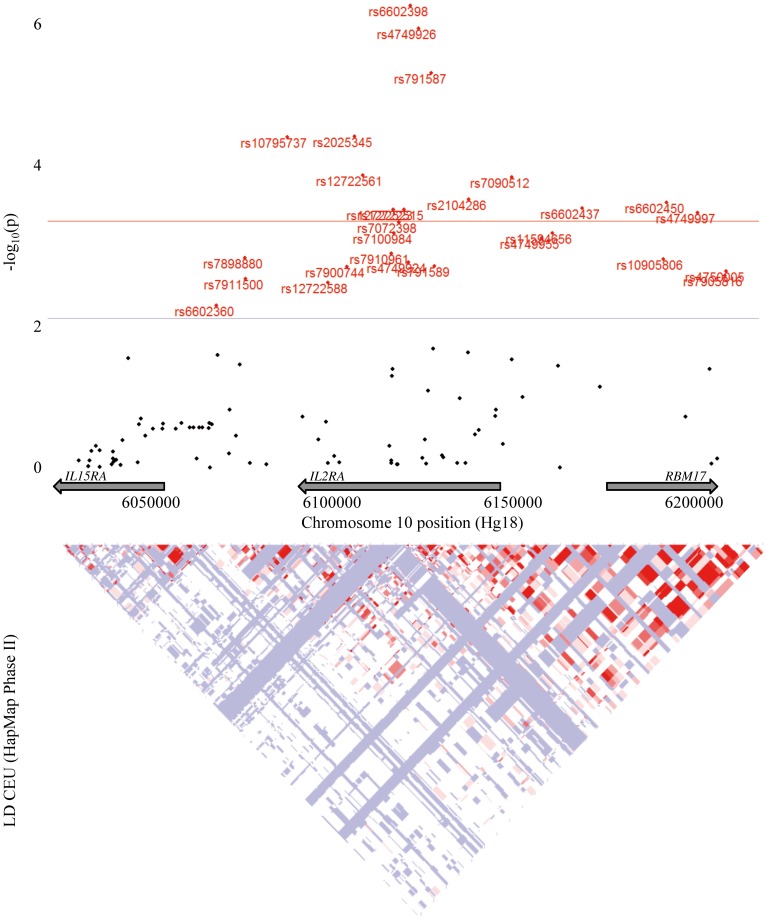
Figure 3. Association results for the IL2RA region and CpG −373.
Manhattan plot represented p-values of Wald test based on linear regression model (for each SNP, association test performed in plink which compares the quantitative phenotype means for three genotypes). The red horizontal line represents the significance threshold of P = 4.7×10⁻⁴.

