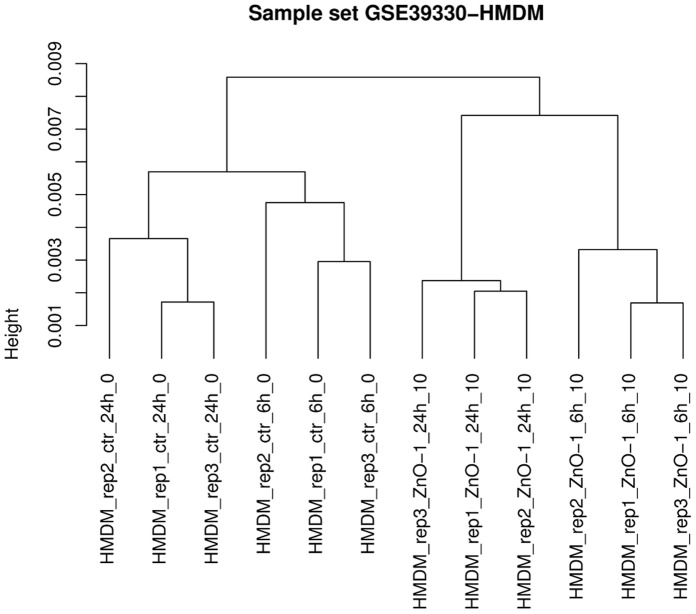
Figure 2. Example of clustering analysis in NanoMiner.
The figure shows the clustering of the human monocyte-derived macrophages (HMDM) exposed to 10 µg/ml of ZnO nanoparticles for 6 or 24 hours or left as controls in dataset GSE39330. The clustering was performed using all data (12 samples and 17,617 genes) with Pearson correlation distance and average linkage.

