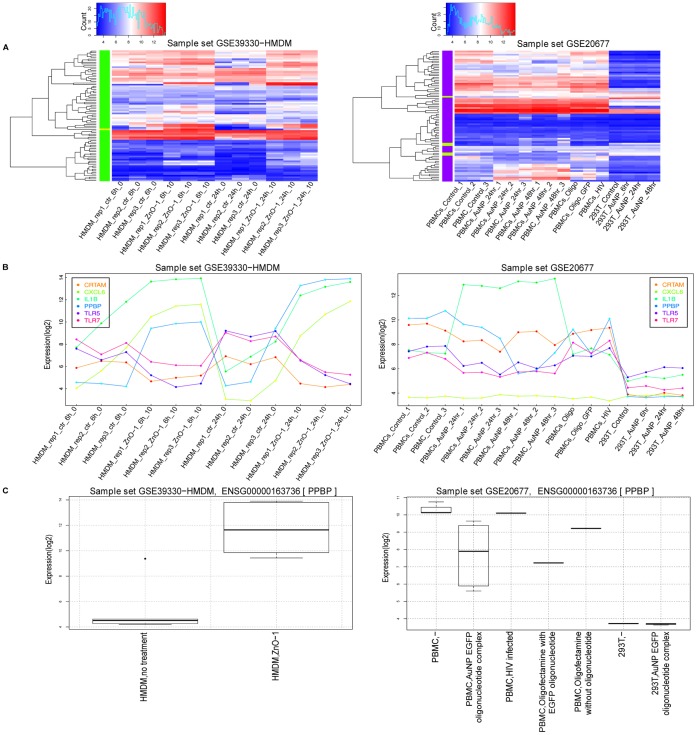
Figure 3. Gene-centric visualization options in NanoMiner.
82 genes (Table S6) from “GO:0006955: immune response” were detected as differentially expressed genes in HMDM cells treated with 10 µg/ml ZnO-nanoparticle compared to untreated control cells at 24 hours in dataset GSE39330. A) The heatmap presentation of the expression of these genes in GSE39330 and GSE20677. B) The expression profile of the three most highly upregulated (PPBP, CXCL6, IL1B) and downregulated genes (CRTAM, TLR7, TLR5) after exposing HMDM cells with 10 µg/ml of ZnO-nanoparticle for 6 hours belonging to GO term GO:0006955: immune response plotted over all the samples in GSE39330 and GSE20677. C) Boxplots of the expression level of gene PPBP in the datasets GSE39330 and GSE20677 by treatment.

