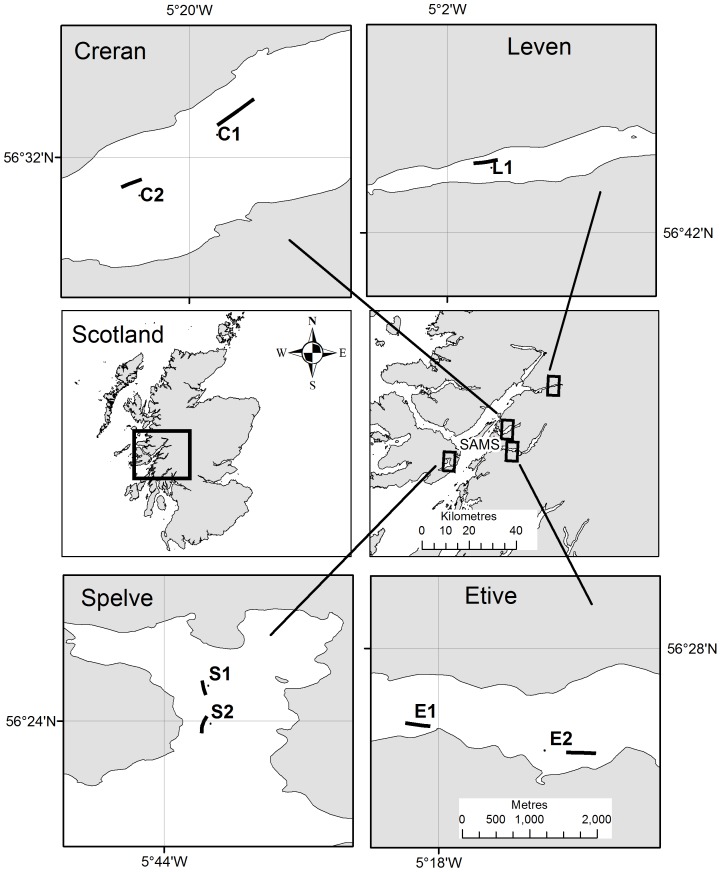
Figure 1. Sampling sites.
Sampling sites in Creran (C1 and C2), Etive (E1 and E2), Leven (L1) and Spelve (S1 and S2). The central map (left) shows Scotland, the area within the box is shown on the right. The sampled farm sites are shown in the large-scale maps, all 1∶50,000 (scale bar shown in Etive applies to all large-scale maps). Latitude and longitude in degrees, minutes (WGS84) are shown on the larger scale maps. The location of the laboratory (‘SAMS’) is shown in the central map (right).

