
Figure 3. GAMM model illustrating shell-hash (Hash) as a function of distance (Dist).
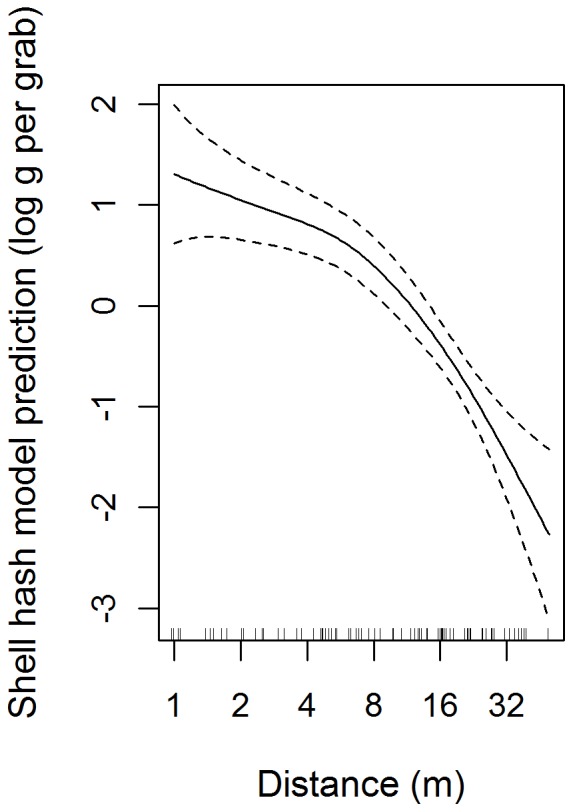
The rug on the bottom axis illustrates sample positions. The solid line indicates the model predictions with 95% confidence intervals shown as dashed lines.
Official websites use .gov
A
.gov website belongs to an official
government organization in the United States.
Secure .gov websites use HTTPS
A lock (
) or https:// means you've safely
connected to the .gov website. Share sensitive
information only on official, secure websites.
The rug on the bottom axis illustrates sample positions. The solid line indicates the model predictions with 95% confidence intervals shown as dashed lines.