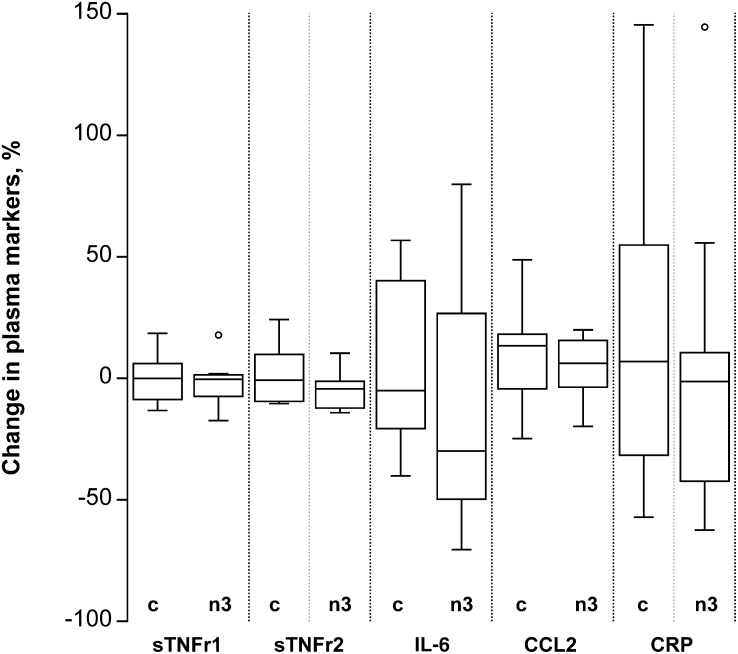
FIGURE 2.
Percentage change in systemic markers of inflammation in overweight to moderately obese men and women after 14 wk of either a control diet or an n3 PUFA–enriched diet. Percentage change calculated at wk 14 (CRC3) minus baseline (CRC1) in plasma. Box plots depict the IQR, median (horizontal line), and outliers (open circles) for the control diet group (“c”, n=13) and the n3 PUFA diet group (“n3”, n=13). CCL2, chemokine (C-C motif) ligand 2; CRC, Clinical Research Center; CRP, C-reactive protein; IL-6, interleukin 6; sTNFr1, soluble tumor necrosis factor α receptor.

