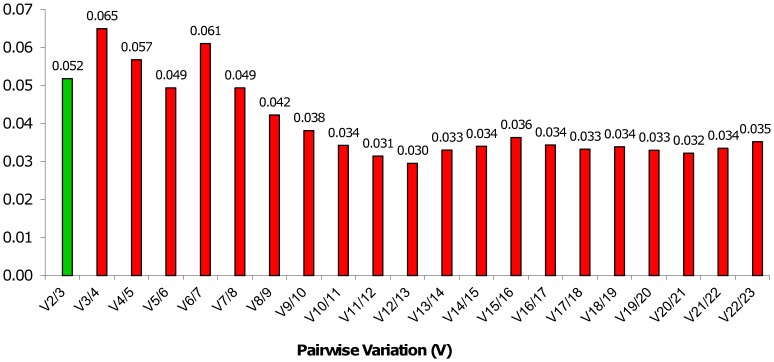
Figure 4. Pairwise variation (V) between the normalization factors (NFn and NFn+1) to determine the optimal number of reference genes.
V2/3 represents the pairwise variation between the NF values estimated for the two genes YLS8 and DRH1 and the NF values estimated for the three genes, YLS8, DRH1 and TIP41, and adding all 23 genes in the same way.

