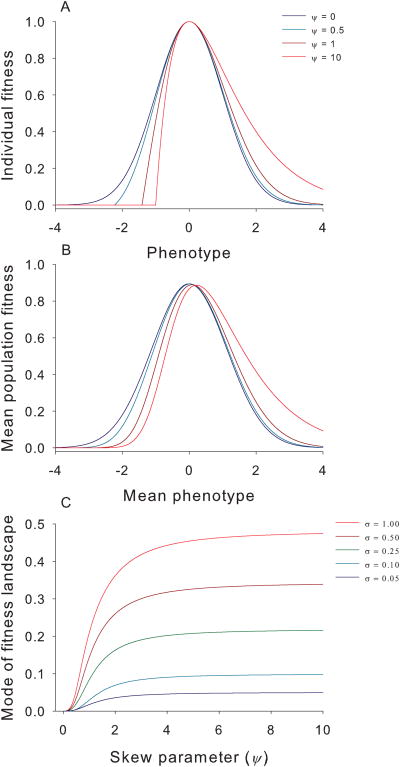
Fig. 2. Skew affects individual fitness surfaces and adaptive landscapes.
a)The individual fitness surface becomes more skewed with increasing ψ, ranging from a symmetric Gaussian distribution (dark blue) to a highly skewed distribution (red). We fix the mode of individual fitness surface at zero and strength (curvature) of stabilizing selection at -1 [equation(5)]. b)The mean population fitness depending on mean population phenotype (i.e., the adaptive landscape)based on the same individual fitness curves in (a) and assuming σ = 0.25. c)The mode of the adaptive landscape diverges from the optimum of the individual fitness surface in (a) which is set to zero with increasing skew and σ.

