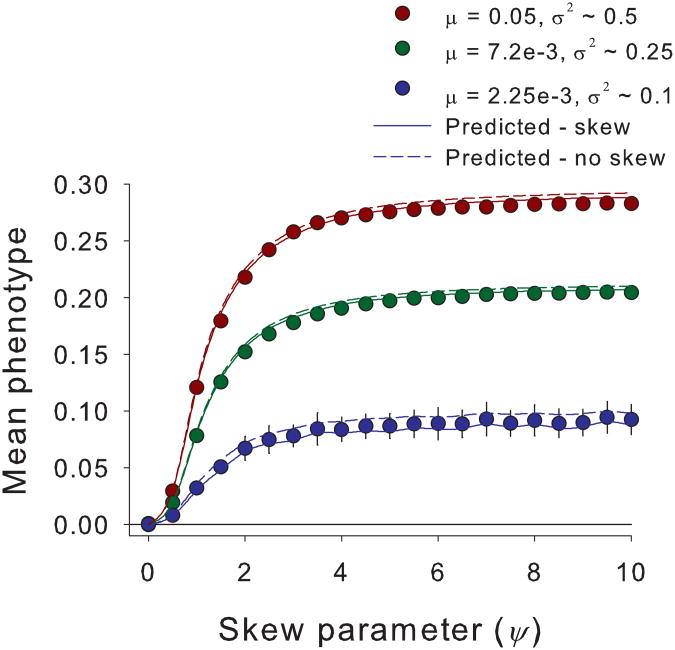
Fig. 3. Analytical results predict simulated evolution of mean phenotypes.
The equilibrium mean phenotype calculated from simulations (n = 50; circles ± SEM) becomes increasingly divergent from the individual fitness optimum at zero with higher ψ, which increases skewness. The equilibrium mean phenotype also increases with higher mutation rates (μ) which determine genetic variances (σ2). We also plot theoretical predictions with (solid line) and without (broken line) skewness incorporated. Theory that includes the effect of skewness (solid line) predicts genetic simulation results accurately, especially at lower variances (green and blue symbols).Parameters not listed in the inset are K=5000, δ = 0.25 for μ = 0.00225 and 0.0072, and δ = 0.35 for μ = 0.05.

