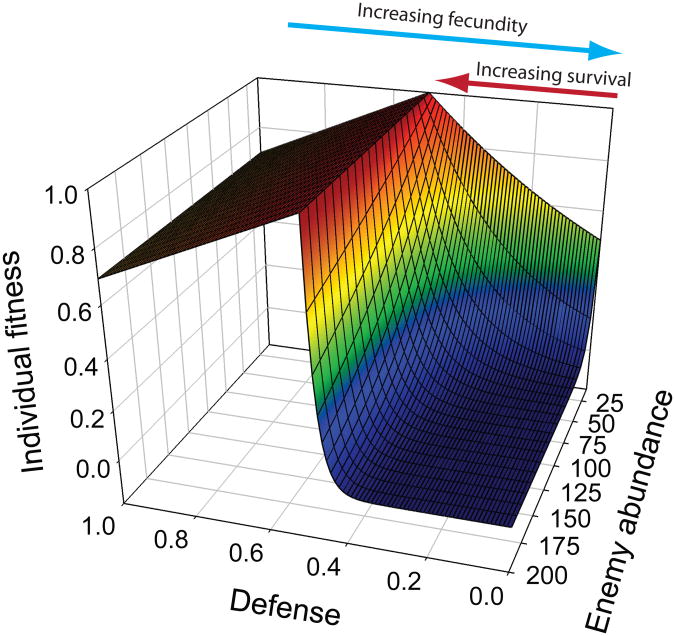
Fig. 4. Asymmetric selection causes evolution of extraordinary defences.
Fitness surfaces and mean defences differ based on enemy density and intraspecific variance. a) Survival increases from right to left up to a point of invulnerability when defence levels = 0.5 (red arrow; eq. 7). Fecundity increases toward the right because we assume that investment in defence has a fecundity cost (blue arrow). This fecundity cost is most visible beyond the point of invulnerability. From back to front, enemy abundance increases. Increased enemy abundance increases the asymmetrical selection for defences even though the peak of the individual fitness surface remains constant at 0.5. Parameters: amax = 0.1, γ = 0.2, c = 0.6, N = 10, K = 2000, δ = .0.5. b) The mean equilibrium defence differs depending on enemy abundance and trait variance in the victim population. Without intraspecific variance, the optimal defence equals 0.5when predator density > 4 (green line). With intraspecific variance, the optimal defence exceeds 0.5 for most enemy densities (blue symbols) with greater divergence when variance is higher (light blue symbols, σ2 ≈0.0015; dark blue symbols, σ2 ≈ 0.0035). Theoretical predictions (solid lines) predict mean defence optima (n = 50) ± 3%. Same parameters used as for a)except N is dynamic and μ = 1e-3 and 5e-4 for the low and high variance simulations, respectively and b = 0.05, d = 0.02.

