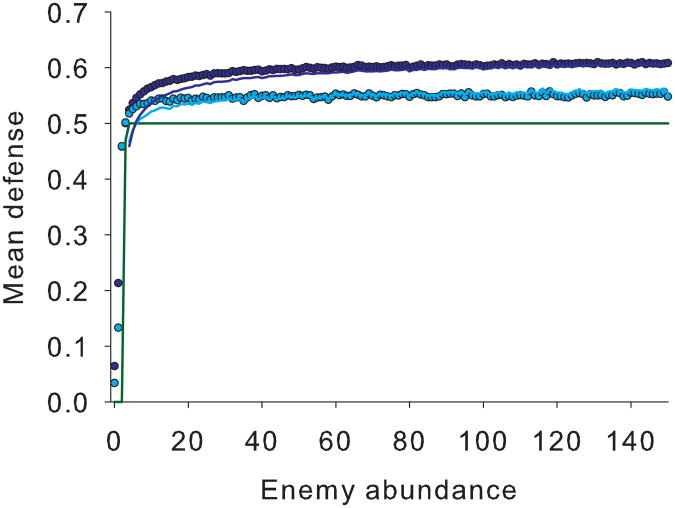
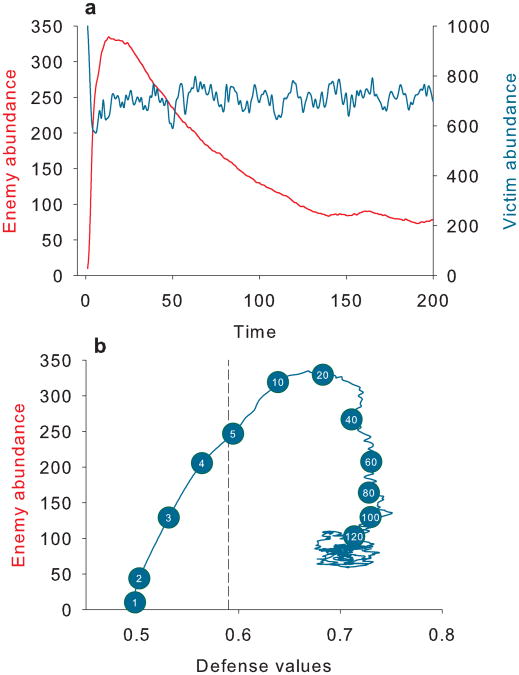
Fig. 5. Eco-evolutionary dynamics enhance asymmetric selection.
In a), enemy (red) and victim (blue) abundances are shown through time. In b), enemy abundance is depicted relative to mean victim defences(generation number is shown in numbered circles). The dashed line indicates the optimal defence without intraspecific variance given the initial predator abundance. Parameters are the same as for Fig. 4b high variance simulations except c = 0.2.


