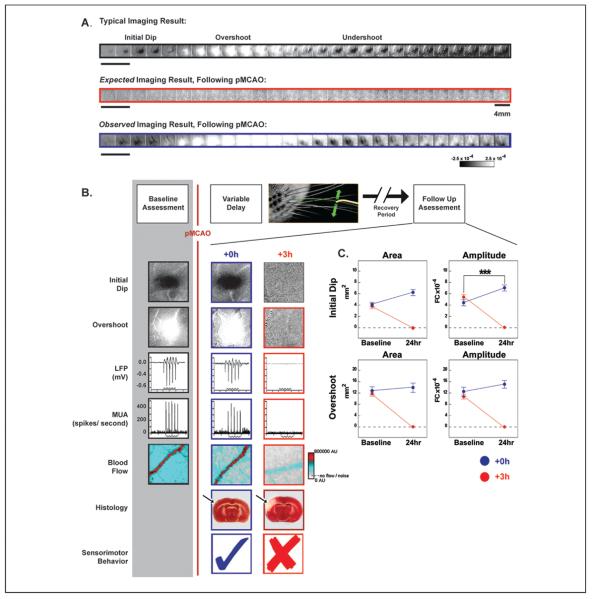
Figure 1.
Experimental design and representative cases. (A) Representative cases of a typical alternating triphasic evoked functional response to whisker stimulation (top, black), including the initial dip (dark patch), overshoot (white patch), and undershoot (dark patch). Next, the expected imaging result following permanent middle cerebral artery occlusion (pMCAO; middle, red), and the observed imaging result collected following pMCAO (bottom, blue). Each box represents 500 ms. Step function located to left of imaging examples indicates whisker stimulation. Scale bar, middle row right side, indicates 4 mm. Linear grayscale bar, located bottom right, indicates intrinsic signal strength ×10−4 fractional change (FC). (B) Top, schematic of the within animal experimental design. Each box denotes manipulations performed before and after pMCAO (denoted by red vertical line). Below, representative images from +0h and +3h subjects' initial dip and overshoot phase of the evoked functional response to whisker stimulation, local field potential (LFP), multi-unit activity (MUA), blood flow imaging (step function indicates stimulus delivery), 2,3,5-triphenyltetrazolium chloride (TTC; arrow indicates region of ischemia) histology collected before and 24 hours after pMCAO. Within the TTC images, note that the area devoid of staining (white) within the +3h subject's left cortex indicates ischemic infarct due to an occlusion of the left MCA. (C) The evoked functional response to whisker stimulation, quantified for immediate (+0h) and delayed (+3h) groups. In each plot, +0h (blue) and +3h (red) group data at pre-manipulation baseline is paired with +24-hour data. Means and standard errors are provided for the area (left column) and amplitude (right column) of the initial dip and overshoot of the evoked functional response to whisker stimulation before and 24 hours after pMCAO. A value of zero indicates no response to whisker stimulation. Asterisks indicate significant differences between baseline and 24-hour values for the +0h group (***P = .0086). Data in panels A, B, and C are from Lay and others (2010); used with permission of authors and publisher.

