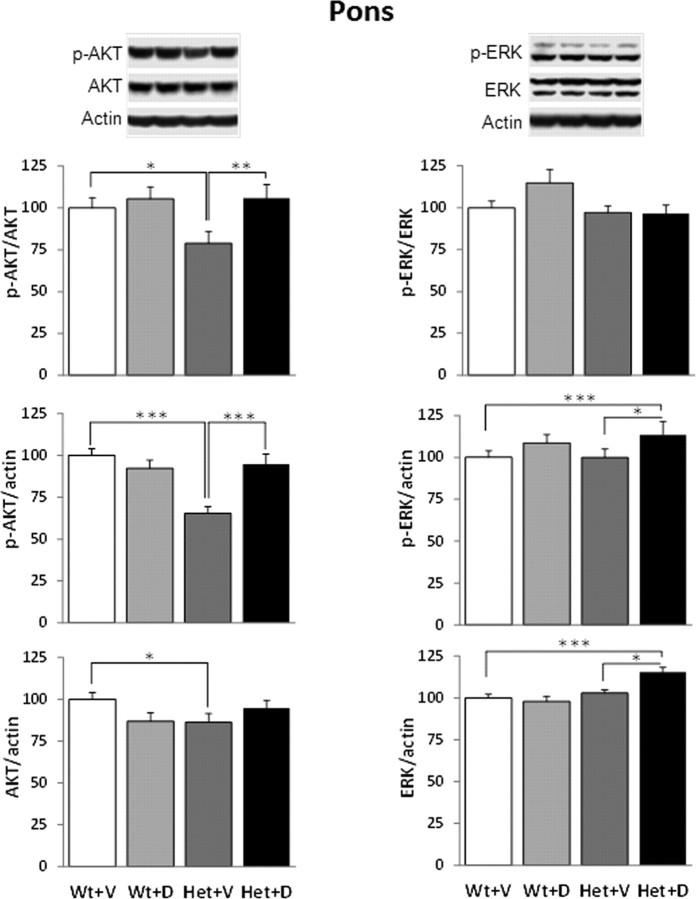
Figure 5.
AKT phosphorylation deficits in the pons of Mecp2 Het mice are reversed by chronic treatment with LM22A-4. Top, Representative Western blots showing p-AKT, total AKT (AKT), p-ERK, total ERK (ERK), and actin in pons samples from (left to right in each blot) Wt+V, Wt+D, Het+V, and Het+D mice. Graphs, Summary results showing the ratios of p-AKT/AKT, p-ERK/ERK, p-AKT/actin, p-ERK/actin, AKT/actin and ERK/actin in pons samples from all four treatment groups (open bars, Wt+V; light gray bars, Wt+D; dark gray bars, Het+V; black bars, Het+D). Results are expressed as the mean ± SEM (Wt+V, n = 13; Wt+D, n = 7; Het+V, n = 11; Het+D, n = 14). *p < 0.05, **p < 0.01, ***p < 0.001, ANOVA I with post hoc LSD test.

