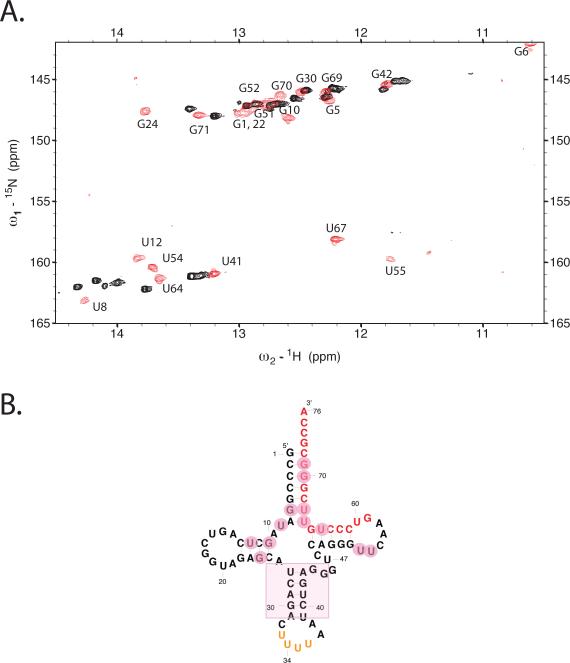
Figure 4. Changes in tRNALys3 conformation upon initiation complex formation.
(A.) 15N-1H TROSY spectrum of uniformly 13C, 15N labeled human tRNALys3 either alone (red) or in 1:1 complex with unlabeled HIV-1 69nt RNA (black). The comparison of the two spectra highlights the large changes in tRNA structure that occurs upon complex formation. (B.) Secondary structure of human tRNALys3; major perturbations (pink circles) of the folded tRNA spectrum upon complex formation with HIV RNA occur in the acceptor, T and D-stems, whereas resonances for the anticodon stem are relatively unperturbed. The spectra were acquired at 800 MHz in 10mM MgCl2 50mM NaCl, 10mM Na phosphate, pH 6.5 at 25°C using a T1-relaxation optimized TROSY pulse sequence as described in the text for improved signal-to-noise.

