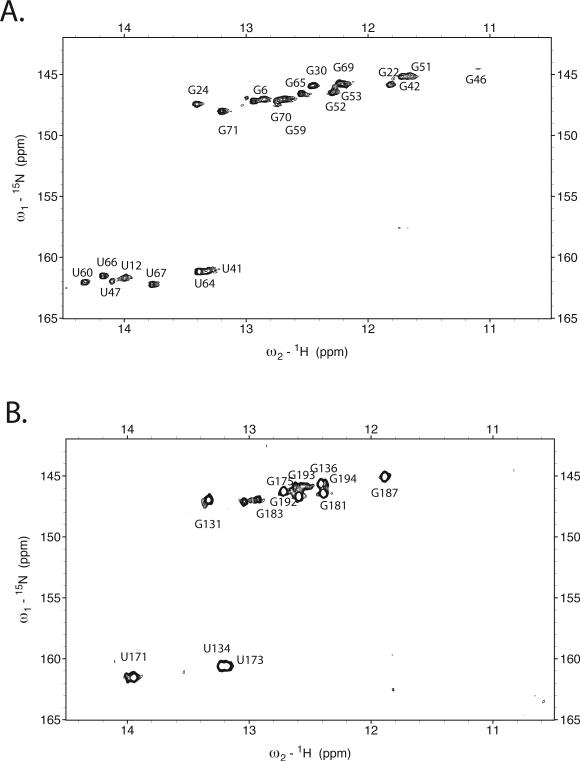
Figure 5. 1H-15N TROSY experiments for the HIV initiation complex at 1:1 tRNALys3-HIV RNA stoichiometry.
(A.) Spectrum for initiation complex formed with uniformly labeled 13C, 15N-tRNALys3 and unlabeled HIV-1 69nt RNA. (B.) Spectrum for initiation complex formed with uniformly labeled 13C, 15N-HIV-1 69nt RNA and unlabeled tRNALys3. Spectra were acquired at 800 MHz 1H frequency T1-relaxation optimized TROSY at 25°C. Spectral assignments of the imino resonances as discussed in the text are indicated.

