Fig. 5.
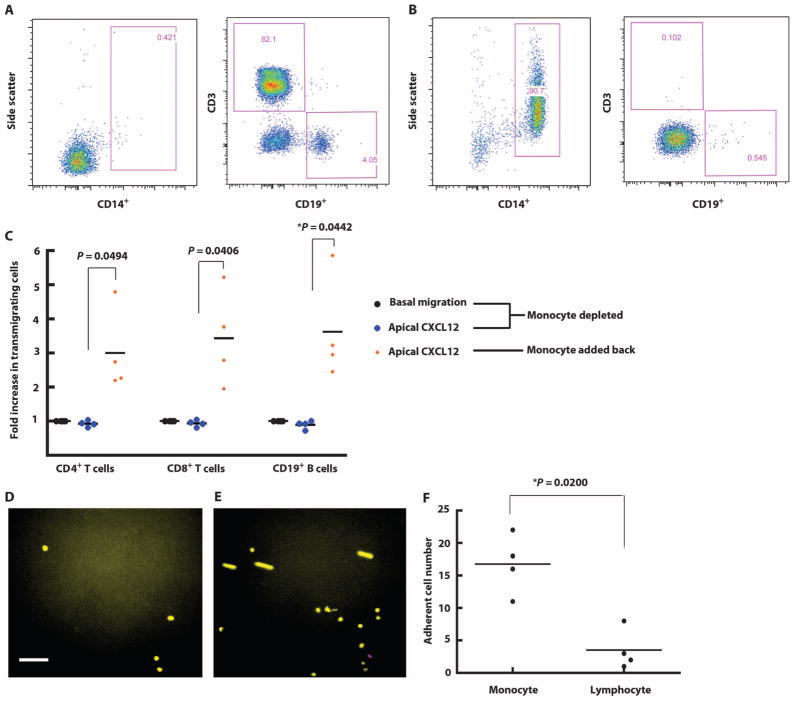
CXCL12-induced monocyte-endothelial cell interactions modulate lymphocyte transmigration. (A) Lymphocytes were isolated from PBMCs using negative selection. Isolated lymphocytes were stained for CD4, CD8, CD14, and CD19 markers to verify purity. (B) Monocytes were isolated from PBMCs using a monocyte negative selection kit. The purity was confirmed by flow cytometry. (C) The transmigration assay was performed in the presence or absence of apical CXCL12. Isolated lymphocytes were used as the input population at 4 × 10⁵ lymphocytes/ml. In the group where monocytes were added back, monocytes were mixed with lymphocytes at a ratio of 1:4 as the input population with a total concentration of 5 × 10⁵ cells/ml. The transmigration assay was performed in the presence of apical CXCL12. Each symbol represents data from one experiment. *P < 0.05 using Student’s t test. (D) Monocytes (yellow) and lymphocytes (purple) were labeled with green and red CellTracker dye and mixed at a ratio of 1:4 as the input population. The final concentration was 5 × 10⁵ cells/ml. The 20-min adhesion assay was performed using the parallel plate flow chamber. Images show PBMC adhesion at the beginning (D) and the end (E) of the assay. The color channels of images were adjusted for readers with color blindness. Scale bar, 60 μm. (F) Videos recording the adhesion assays were analyzed by a blinded observer on NIH ImageJ software. The motions of each cell that flowed into the field and adhered during the shear stress application period were tracked and quantified. Each symbol represents data from one experiment. *P < 0.05 using Student’s t test.

