Figure 1.
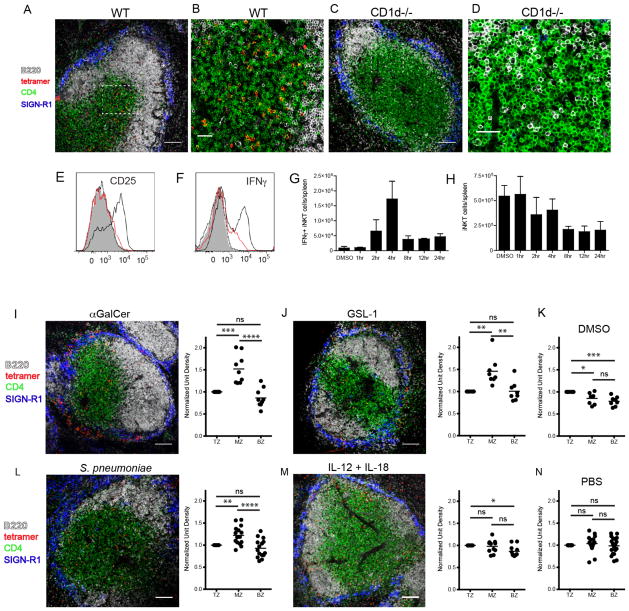
Localization of iNKT cells under steady-state and various activating conditions. (A–D) Confocal images of CD1d tetramer labeling of spleen sections from unimmunized wildtype (A,B) or CD1d-deficient Balb/c mice (C,D). (B and D) Show the dashed insets in A and C, respectively, at higher magnification. (E) Histogram depicting FACS measurement of CD25 expression by CD1d-tetramer+ splenocytes at 1hr (dotted), 2hr (red) and 4hr (solid black) following immunization. The filled histogram represents the DMSO vehicle control at 4 hours post-immunization. (F) Histogram depicting intracellular IFNγ by tetramer+ cells as described in E. (G) Bar graph indicating the number of IFNγ-producing CD1d-tetramer+ splenocytes detected by FACS analysis at various time points after DMSO vehicle or αGalCer immunization. (H) The total number of CD1d-tetramer+ iNKT cells per spleen detected by FACS following DMSO vehicle or αGalCer immunization over time. (I–N) Confocal images and quantitation of CD1d tetramer labeling of spleen sections from Balb/c mice immunized 4 hours prior with αGalCer (I) or GSL-1 (J), 8 hours prior with S. pneumoniae (L), or 2 hours prior with IL-12 + IL-18 (M). (K) and (N) show DMSO and PBS vehicle controls. The quantification of these confocal images is performed as described in Materials and Methods. TZ, T cell zone; MZ, marginal zone; BZ, B cell zone. All data shown is representative of three experiments with two mice per group. Scale bar equals 100 μm (A, C, I, J, L, M) and 30 μm (B,D). *p<0.05, **P<0.001, ***p<0.0001, ****p<0.00001; ns, not significant.

