Figure 2.
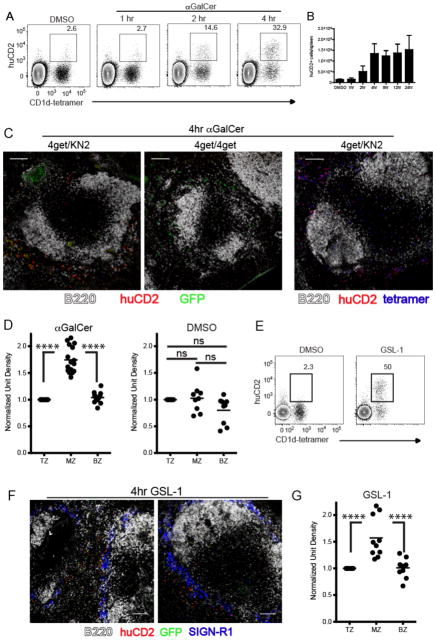
Early IL-4 production by iNKT cells occurs at the splenic marginal zone. (A) 4get/KN2 mice were immunized with either DMSO vehicle or αGalCer and live B220- splenocytes were assessed for expression of huCD2 (IL-4 production) by flow cytometry at the time points indicated. Numbers represent the frequency of huCD2+ cells of the CD1d tetramer+ population. DMSO vehicle treated mice were assessed at 4 hours post-immunization. (B) The total number of huCD2+ cells per spleen at various time points following DMSO vehicle or αGalCer immunization. (C) Spleens were harvested from αGalCer-immunized 4get/KN2 or 4get/4get mice and assessed for localization of huCD2 expression as described in Materials and Methods. (D) Quantitation of huCD2 labeling intensity in distinct splenic regions following αGalCer or DMSO vehicle immunization as described in Figure 1. (E) 4get/KN2 mice were immunized with either DMSO vehicle or GSL-1 and live B220- splenocytes were assessed for huCD2 expression at 4 hours post-immunization. Numbers represent the frequency of huCD2+ cells of the CD1d tetramer+ population. (F) Spleens harvested from GSL-1-immunized 4get/KN2 were assessed for location of huCD2 expression. SIGN-R1 delineates the MZ. (G) Quantitation of huCD2 labeling intensity in distinct splenic regions following GSL-1 immunization. Scale bar, 100 μm. All data shown is representative of at least 3 individual experiments with 3–4 mice per group. Error bars represent standard deviation. ****p<0.00001; ns, not significant.

