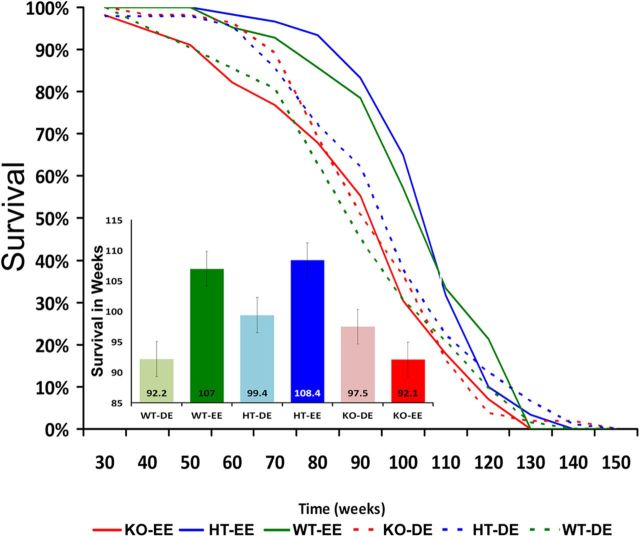
Figure 4.
Kaplan–Meier survival curves of mice as a function of genotype and exposure to an EE or DE. Insert, Lifespan per group (mean and SE). WT and HT mice reared in an EE lived significantly longer than when reared in a DE. In contrast, survival of DRD4 KO mice was not increased when reared in an EE compared with a DE and was shorter than that of WT and HT mice.

