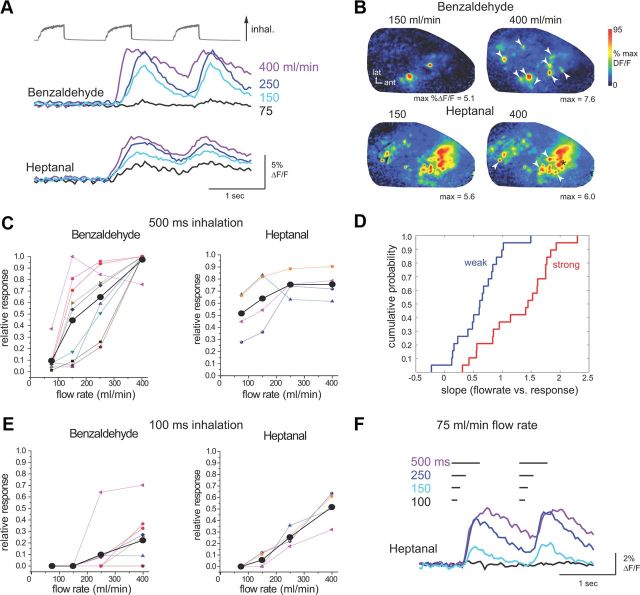
Figure 1.
Odorant sorption affects flow-rate dependence of ORN responses during artificial inhalation. A, Presynaptic calcium signals imaged from ORNs in vivo during artificial inhalation of a strongly sorbed (benzaldehyde) and weakly sorbed (heptanal) odorant. Traces show calcium signal taken from one glomerulus during inhalation at increasing flow rates (indicated by numbers at right). Glomeruli are different for each odorant. Increasing flow rate leads to increased peak amplitude and decreased latency of responses. B, Peak response maps from the same preparation evoked by inhalation of each odorant at 150 and 400 ml/min. Each map is normalized to its own maximum. For each odorant, increasing flow rate activates additional glomeruli in the map. Arrowheads indicate glomeruli plotted in C; asterisk indicates glomerulus shown in F. C, Flow rate–response relationships plotted for multiple glomeruli activated by each odorant (same preparation as in A and B). Thick black plot shows mean response across activated glomeruli. Note that slope appears shallower for heptanal than for benzaldehyde. Response axis normalized to maximal response for each glomerulus. D, Cumulative probability distribution for normalized flow rate–response slopes for all glomeruli, plotted for weakly and strongly sorbed odorants. E, Flow rate–response plots for ORN inputs to the same glomeruli in the same preparation, but using shorter-duration (100 ms) inhalations. At this duration, the lowest flow rate (75 ml/min) fails to evoke inputs to any glomeruli. Also heptanal flow rate–response slopes are steeper and appear more linear than for longer-duration (500 ms) inhalations, indicating less saturation of ORN responses (see C). F, Calcium signals from one glomerulus (B, asterisk) showing responses to inhalations ranging in duration from 100 to 500 ms, using the lowest flow rate. Responses are nearly undetectable for 100 ms duration and begin to show saturation between 250 and 500 ms duration.

