Figure 2.

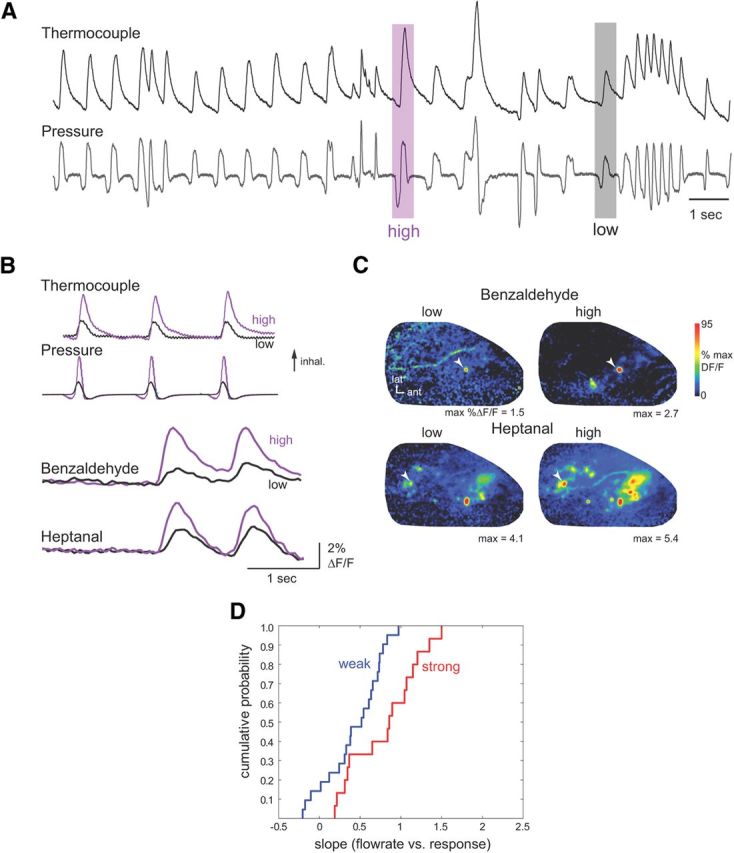
Sorption effects are weaker during playback of naturalistic sniffs in the anesthetized rat. A, Derivation of low and high flow rate “sniffs” from the awake rat. Traces show simultaneous measurements of intranasal airflow measured via a thermocouple (top trace) and intranasal pressure (lower trace) measured through the same cannula. Inward airflow and negative pressure (inhalation) are up. Purple and gray shaded boxes indicate inhalations generating low and high peak flow rates as measured via thermocouple. The corresponding pressure traces were used as command waveforms for sniff playback. See Materials and Methods for details. These boxes illustrate examples only; actual waveforms are shown in B. B, Presynaptic calcium signals from ORN input to a glomerulus evoked by playback of the low and high flow rate “sniffs” for benzaldehyde and heptanal. Top traces show intranasal airflow (thermocouple) and pressure measured during playback. Same animal as for artificial inhalation in Figure 1A–C. C, Peak response maps (same preparation) for both odorants, evoked by playback of low and high flow rate sniffs. Each map is normalized to its own maximum. For each odorant, the stronger sniff evokes input to more glomeruli and with increasing amplitude. Arrowheads indicate glomeruli plotted in B. Note that sniff playback evokes input to many fewer glomeruli than does 500 ms artificial inhalation (compare with Fig. 1B, maps). D, Cumulative probability distribution for flow rate–response slopes derived from the two sniff strengths (see Results, Materials and Methods for details) for all glomeruli, plotted for weakly and strongly sorbed odorants.
