Figure 6.

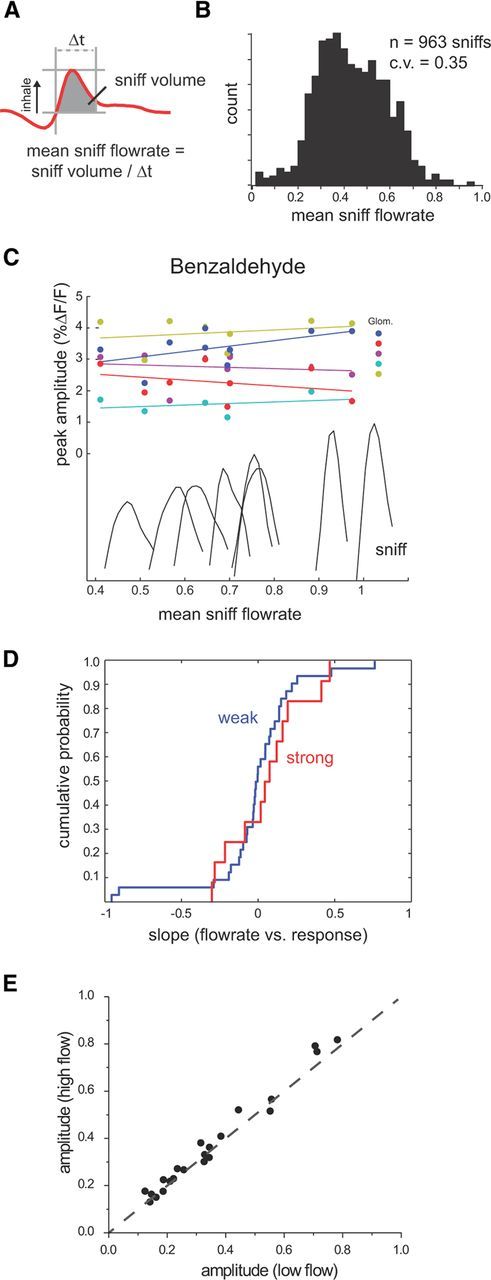
ORN-response amplitudes are not shaped by mean inhalation flow rate during natural odor sampling. A, Schematic illustrating measurement of mean inhalation flow rate from intranasal pressure recordings in awake, head-fixed rats. Mean flow rate is estimated from inhalation volume (gray-shaded area) divided by inhalation duration (Δt). B, Histogram of mean flow rates measured in one behavioral session and scaled as for peak flow measurements. C, Plots of ORN response versus mean inhalation flow rate for the first inhalation in all trials of strongly sorbed benzaldehyde in one session. Responses are plotted for five glomeruli and normalized as in Figure 4C. Traces show the intranasal pressure waveform for each inhalation in the plot. Lines show linear fit to each data series. D, Cumulative probability distributions for mean flow rate–response slopes for first inhalations in awake, head-fixed rats sampling strongly sorbed (red) and other odorants (blue), normalized as in Figure 5A. E, Normalized response amplitudes for ORN inputs to glomeruli evoked by low-flow and high-flow inhalations of all odorants.
