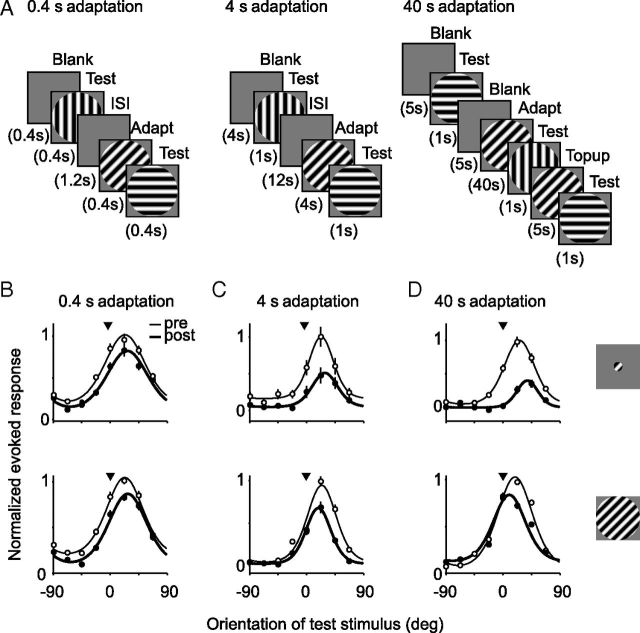
Figure 1.
A, Stimulus presentation protocols for 0.4, 4, and 40 s adaptation. B–D, Tuning curves of six example units for small (top) and large (bottom) gratings are shown before (thin lines; open symbols) and after (thick lines; filled symbols) 0.4 s adaptation (B), 4 s adaptation (C), and 40 s adaptation (D). Symbols indicate observed responses, and solid lines show fits to the data. Arrowhead indicates orientation of adapter. Error bars indicate SEM. Evoked responses of each unit were normalized by the maximum response across all conditions.

