
Figure 6.
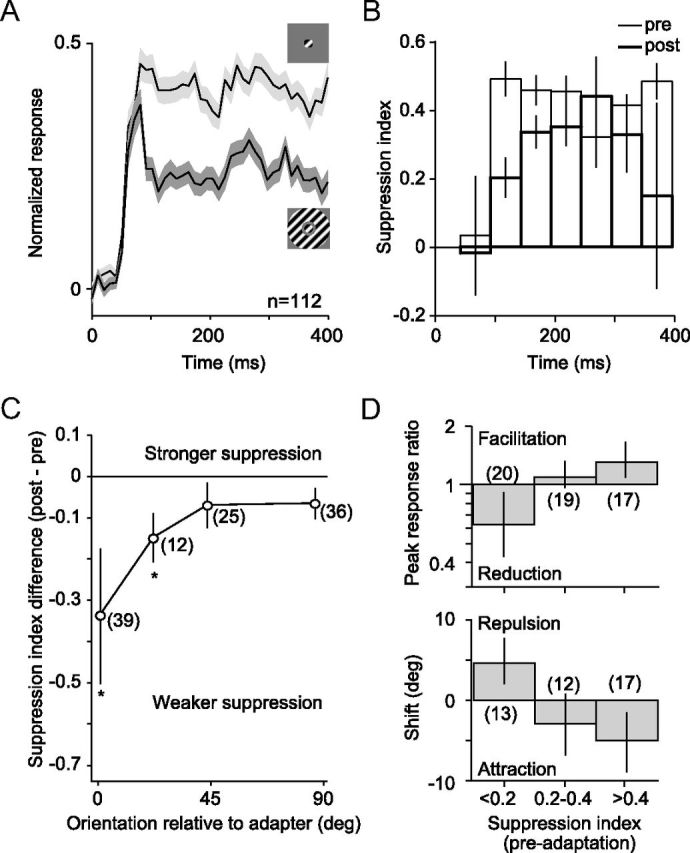
Surround suppression: dynamics and effects of adaptation. A, Population average PSTHs for responses to a preferred, small grating and to the same stimulus when surrounded by an annulus of matched orientation. We normalized the PSTH for each unit by its peak response and then averaged across units. Error bars indicate SEM. B, SI before (thin) and after (thick) 40 s adaptation with an annular grating. Indices were calculated in 50 ms epochs beginning 50 ms after stimulus onset. Error bars indicate SEM. C, Difference (post − pre) in SI, as a function of the preferred orientation of the neuron relative to the adapter. Asterisks indicate statistically significant differences (p < 0.05, no correction for multiple comparisons). Error bars indicate SEM. D, Peak response ratio in preferred-adapted neurons (top) and shifts in preferred orientation in flank-adapted neurons (bottom), after 40 s adaptation with an annular grating. Data are plotted as a function of the preadaptation SI. Error bars indicate 95% confidence levels.