Figure 8.
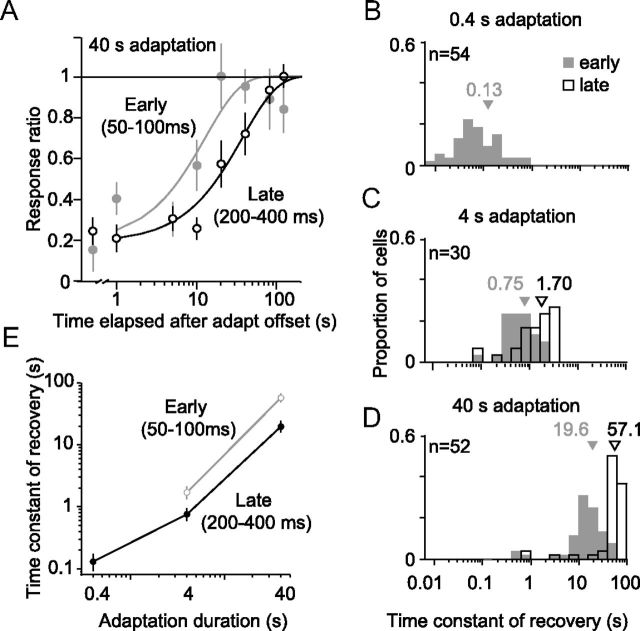
Time constant of recovery. A, Recovery of an example unit after 40 s adaptation for the early (gray) and late (black) response. Data points show observed response as a function of time elapsed from offset of the adapter. Solid lines show fits of the single exponential. B–D, Time constant of recovery after 0.4 s (B), 4 s (C), and 40 s (D) adaptation. The time constant measured for the early response (50–100 ms after stimulus onset) are shown in gray shading and for the late response (200–400 ms) as open bars. E, The average time constants for the early (gray line) and late (black) epochs, as a function of adaptation duration.

