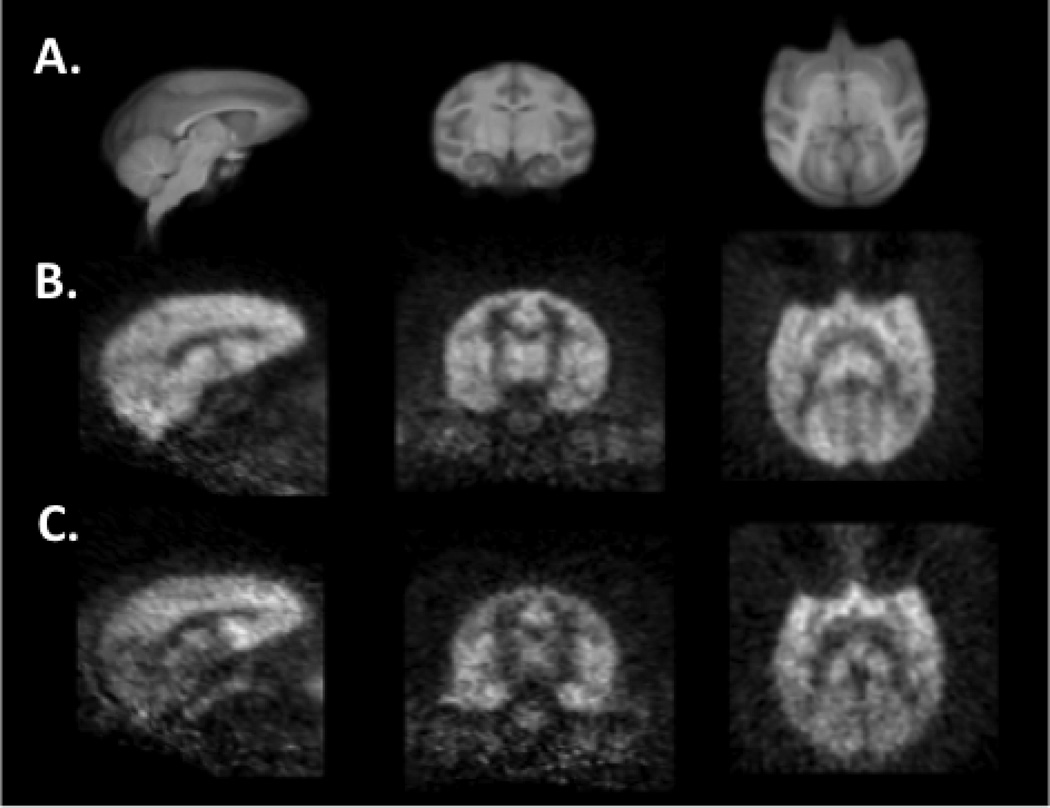
Fig. 2.
An average of eight 0–10 min and 40–60 min summed [11C]ABP688 images under baseline condition normalized to a nonlinear rhesus monkey brain MR template in sagittal, coronal, and transverse views (left to right). A) The high-resolution rhesus monkey brain template was used to delineate regions-of-interest. B) Early 0–10 min summed images exhibited uniform distribution throughout the gray matter. C) Late 40–60 min summed images show a less homogenous distribution with lower uptake in the cerebellum gray matter, which was used as the reference region.

