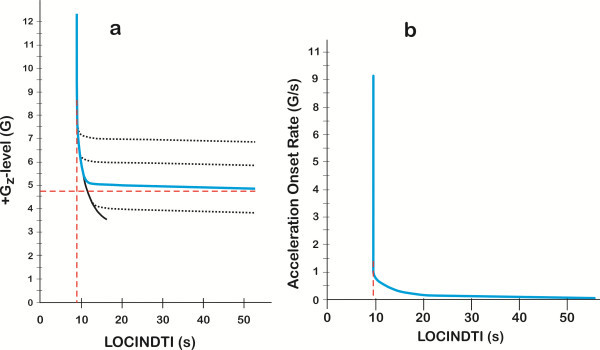
Figure 3.

G-LOC curves for +Gz level and acceleration onset rate as functions of LOCINDTI. +Gz level (a) and acceleration onset rate (b). Asymptotes are shown as dashed lines. The three dotted line horizontal arm tolerances in (a) represent the characteristics of how ranges of different population +Gz level tolerances integrate with the vertical neurologic tolerance arm of the curve.
