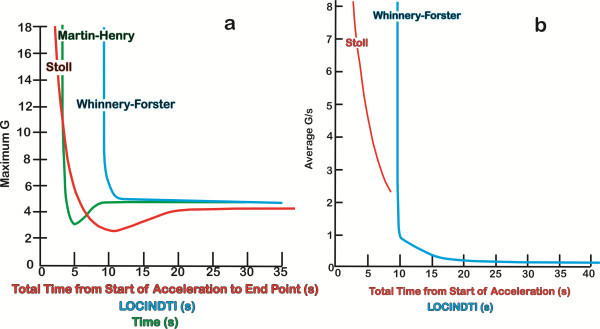
Figure 4.

Comparison of the existing G-LOC tolerance curves. Comparison of the existing G-LOC tolerance curves for (a) +Gz level tolerance comparisons between Stoll (red), Martin-Henry (green), and the current Whinnery-Forster (blue) curves as a function of the loss of consciousness induction time and (b) acceleration onset rate (G/s) as a function of total time from start of acceleration (loss of consciousness induction time) between Stoll and the current Whinnery-Forster curve (curves redrawn from the original manuscripts, with the Martin-Henry curves converted from a logarithmic to linear scale).
