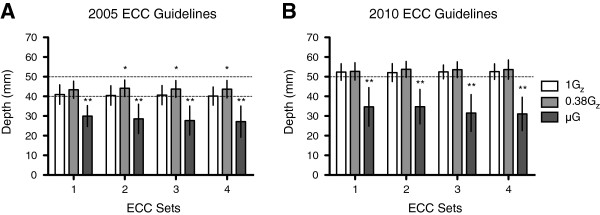
Figure 3.

Mean (±SD) true depth (DT) of ECC at 1Gz, 0.38Gz and μG. (A) The 2005 ECC guidelines. (B) The 2010 ECC guidelines. The dashed line(s) depicts the effective limit(s) of depth for each respective guideline. n = 30; single asterisk denotes p < 0.05, while double asterisk denotes p < 0.001.
