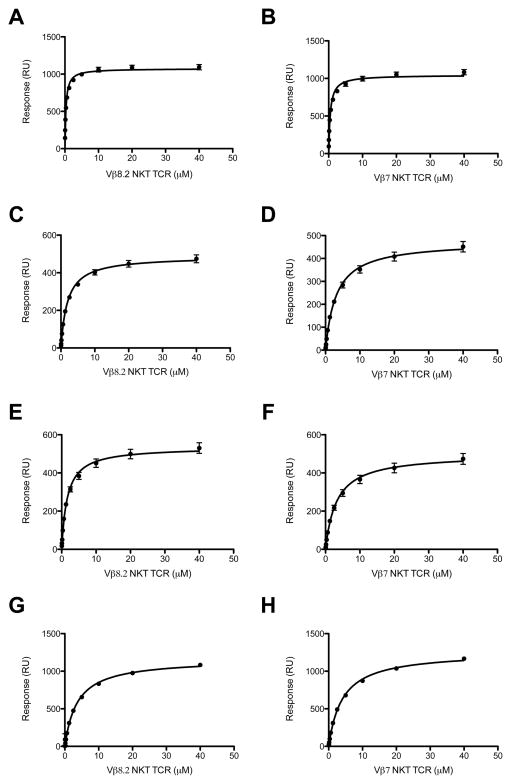
FIGURE 3. Binding analysis of Vβ8.2 and Vβ7 to CD1d-Ag.
Equilibrium binding response curve for Vβ8.2 TCR to CD1d-α-GalCer (A), CD1d-α-C-GalCer (C), CD1d-α-C-alkyne-GalCer (E) and CD1d-α-N-Cyc-Cer (G) and Vβ7 TCR to CD1d-α-GalCer (B), CD1d-α-C-GalCer (D), CD1d-α-C-alkyne-GalCer (F) and CD1d-α-N-Cyc-Cer (H). The equilibrium dissociation constant (KDeq) by fitting to one-site binding model. All results are shown as one experiment performed in triplicate (representative of 2–3 experiments).

