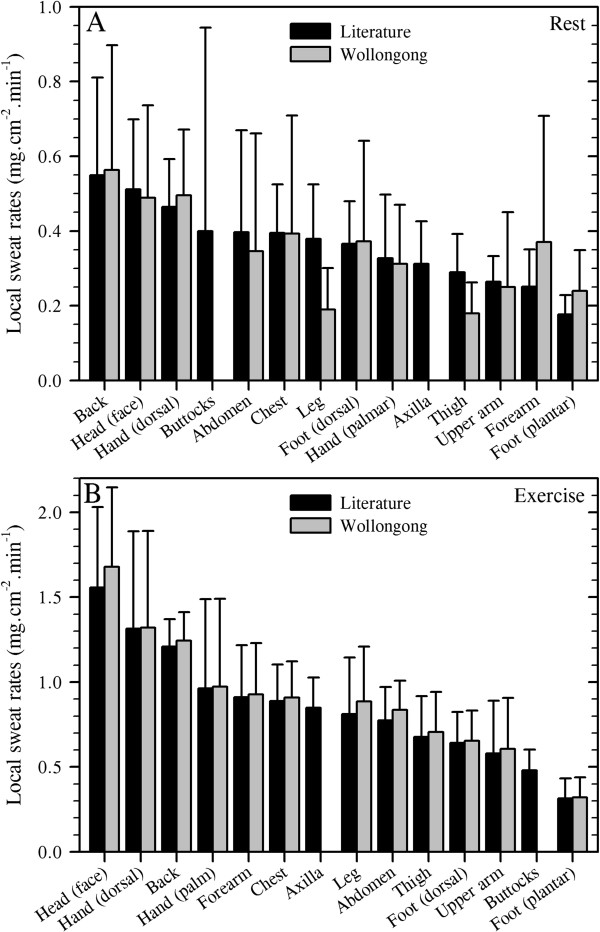
Figure 6.
Comparisons among the regional distributions of eccrine sweating. (A) At rest and (B) during exercise. Data are means with 95% confidence intervals. Values distilled from the literature are also contained within Figures 4 and 5 and are duplicated here (in descending order within each graph) for ease of comparison. Data from authors' laboratory (Wollongong: sweat capsules (capacitance hygrometry)) were collected from the studies reported in Figures 7 and 8 but grouped to match the target 14 regions.

