
Figure 5.
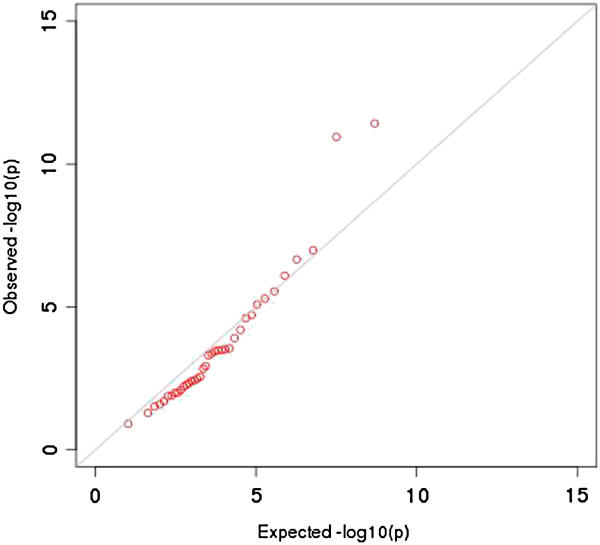
VIP genes are under substantial miRNA regulation relative to the genomic background. The QQ plot shows the association p-values between the VIP genes and miRNA expression traits for all (negatively correlated) miRNA-mRNA pairs. We compared the distribution of the best association p-value per gene for the VIP genes (“observed” data) to that of random sets (each of the same size as that of the VIP genes) of the most significant p-value per gene for the randomly selected genes (“expected” data). Only the negatively correlated miRNA-mRNA pairs were used in this analysis.