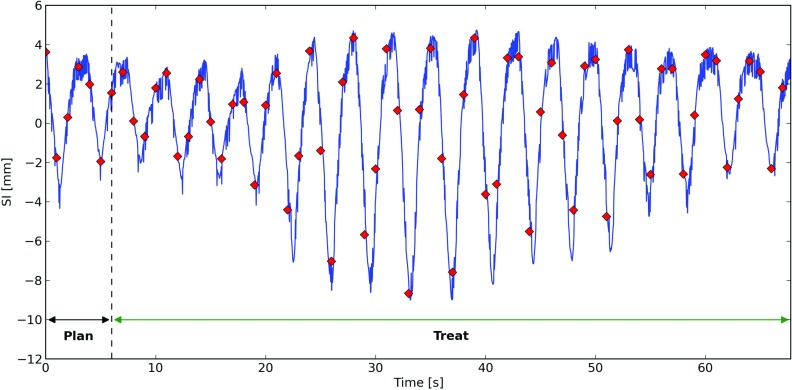
Figure 4.
Superior-inferior (SI) component of the patient breathing trace used to generate the irregular-breathing phantom used in this study. The solid (blue) curve is the measured patient breathing motion. The diamonds (red) show the SI position of the tumor centroid calculated for each time step of the phantom. The time intervals used for treatment planning and treatment simulation using this phantom are also indicated.

