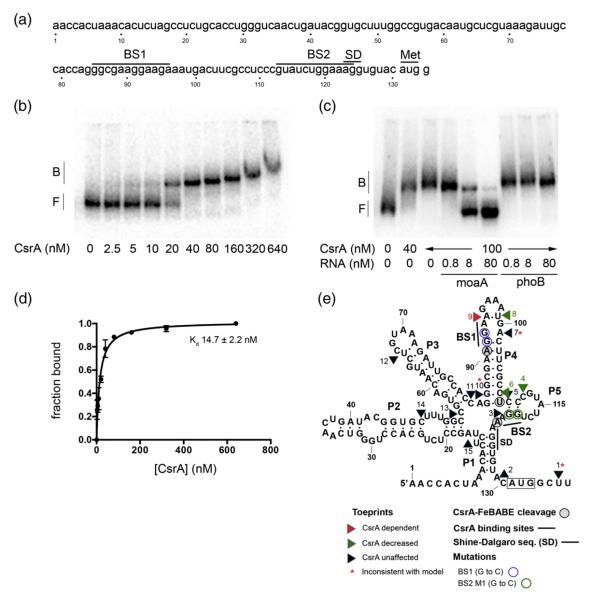
Fig. 1.
Gel mobility shift analyses of CsrA binding to moaA RNA and a secondary structure model summarizing the results of this study. (a) The moaA leader. The nucleotide sequence of the moaA leader used for gel shift analysis is shown. Putative CsrA binding sites (BS1 and BS2) are shown. The translation initiation site (Met) and the SD sequence are shown. (b and c) RNA gel mobility shift assays were performed to analyze the interactions between CsrA and the moaA leader. (b) Increasing concentrations of CsrA were incubated with 32P-labeled moaA leader (80 pM). (c) RNA competition assays. Binding reactions were performed in the presence of unlabeled specific (moaA RNA) or nonspecific (phoB RNA) competitor. The positions of free (F) and bound (B) RNAs are shown. (d) Binding curve for the reaction shown in (b). (e) Structural model of moaA mRNA based on inline probing analyses.41 Results of toeprinting, FeBABE footprinting and gel shift studies with base-substituted moaA RNAs in the CsrA binding sites (BS1 and BS2) are depicted on this structure.

