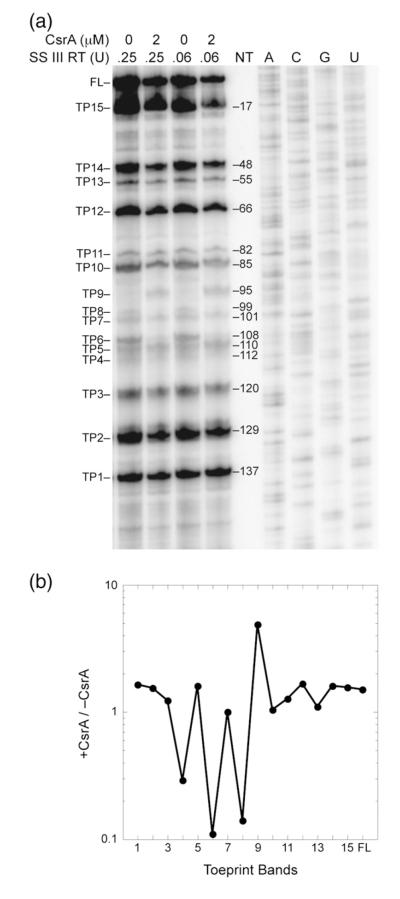
Fig. 7.
Toeprinting analysis of CsrA binding to moaA mRNA. (a) The absence or presence of CsrA (2 μM) and the amount of SuperScript III reverse transcriptase (SS III RT) is shown at the top of each lane. Each toeprint (TP) band is numbered with respect to its position versus the labeled primer. FL, full length. Sequencing reactions (A,C, G,U) for positioning the toeprints with respect to nucleotide sequence are also shown. The toeprinting positions are shown on a structural model for moaA RNA in Fig. 1e. (b) Quantification of the toeprint bands in lanes corresponding to 0.25 U reverse transcriptase. The intensity of each band was normalized to adjust for loading differences by dividing by the total intensity of each lane. Values of +CsrA/−CsrA are plotted with respect to each toeprint band. Bound CsrA caused a 3- to 10-fold.

