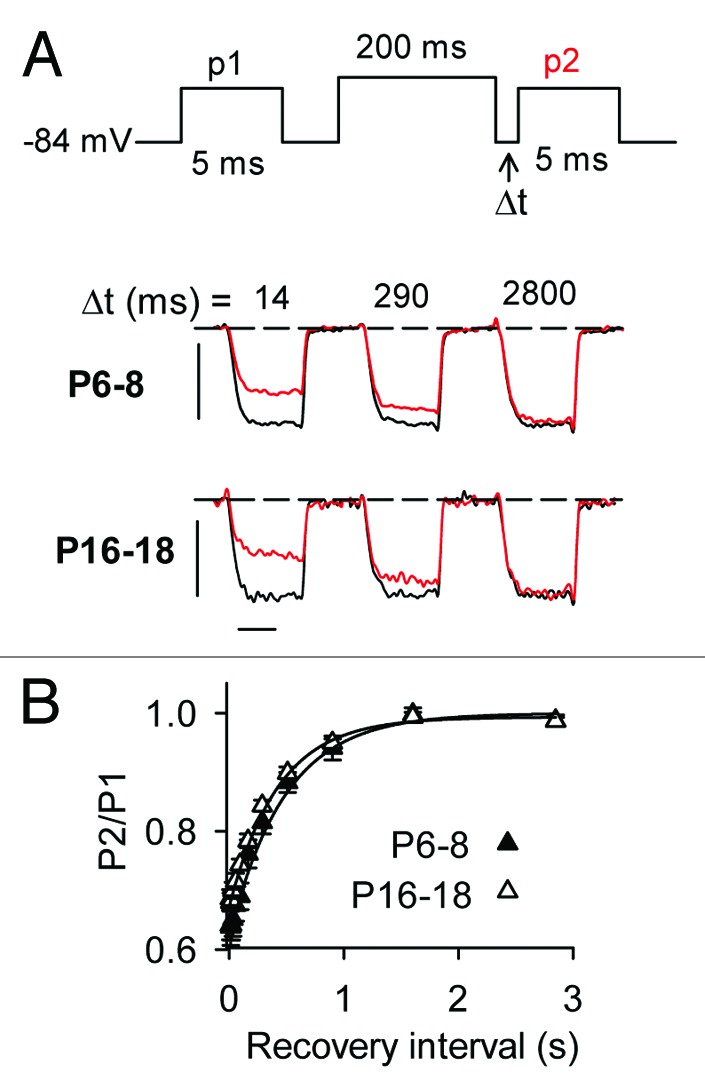
Figure 6. Recovery from CDI does not differ in mature and immature IHCs. (A) Top panel, Voltage protocol in which ICa was evoked by pulses (p1, p2) from −84 mV to −20 mV before and at variable recovery intervals after a 200-ms prepulse to −10 mV. Bottom panel, representative traces for ICa recorded in P6–8 or P16–18 mouse IHCs. Currents evoked by p1 (black) and p2 (red) at the indicated recovery intervals are overlaid for comparison. Scale bars, 0.8 nA (vertical), 2.5 ms (horizontal). (B) Recovery of ICa from inactivation was measured by plotting p2/p1 for data obtained as in (A) against recovery interval. Data were fit with an exponential function (smooth line). Curve fit parameters were: for P6–8 (n = 19), y0 = 0.99, A; −0.321, τ = 425 ms; for P16–18 (n = 8), y0 = 1.0, A = −37.8, τ = 486 ms.
