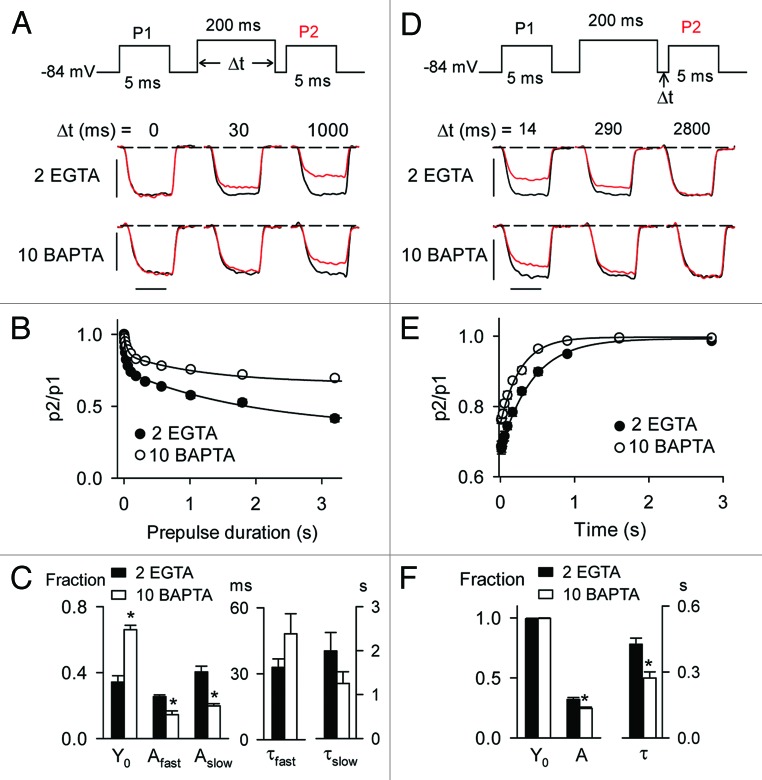
Figure 8. BAPTA slows the onset and accelerates recovery of CDI in immature IHCs. (A) Voltage protocol and representative p1 and p2 current traces for ICa with the indicated prepulse durations. Scale bars, 0.2 nA (vertical), 2.5 ms (horizontal). (B) Graph shows data plotted as in Figure 4B for ICa recorded with 2 EGTA (n = 22) or 10 BAPTA (n = 14). Smooth line represents double exponential curve fit (for 10 BAPTA, y0 = 0.66, Afast = 0.14, τfast = 48.1 ms, Aslow = 0.20, τslow = 1251 ms; see Figure 4B for parameters for 2 EGTA). (C) Average parameters for exponential fits of data in (B).*p < 0.001 by Mann-Whitney rank sum test. (D) Voltage protocol and representative p1 and p2 current traces for ICa with the indicated recovery intervals. Scale bars, 0.2 nA (vertical), 2.5 ms (horizontal). (E) Graph shows data plotted as in Figure 5B for ICa recorded with 2 EGTA (n = 8) or 10 BAPTA (n = 14). Smooth line represents exponential curve fit (y0 = 1.0, A = −0.25, τ = 271 ms see Fig. 5B for parameters for 2 EGTA). (F) Average parameters for exponential fits of data in (E).*p < 0.001 by t- test.

An official website of the United States government
Here's how you know
Official websites use .gov
A
.gov website belongs to an official
government organization in the United States.
Secure .gov websites use HTTPS
A lock (
) or https:// means you've safely
connected to the .gov website. Share sensitive
information only on official, secure websites.
