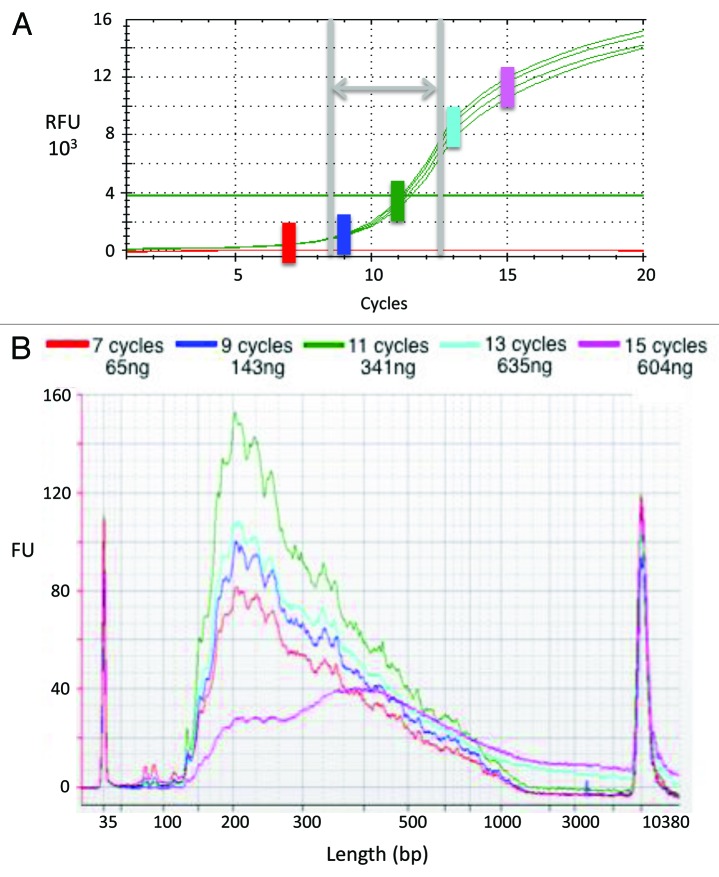
Figure 2. qPCR assay for optimizing second-strand synthesis and library enrichment. The final PCR step of library preparation must generate sufficient yield for SGS, yet avoid biases associated with over-amplification. (A) Amplification curves from qPCR test performed in quadruplicate. First-strand cDNA products generated from human PBMC total RNA served as template in qPCR reactions. The horizontal line indicates the detection threshold. The green vertical bar indicates the cycle number at which fluorescence intensity exceeded the detection threshold [i.e., the cycle threshold, C(t)]; in this experiment, the C(t) is cycle 11. The gray vertical lines and horizontal arrow indicate the range within which the C(t) typically falls. The colored vertical bars [including the green one marking C(t)] indicate the cycle numbers selected for testing in the Figure 2B experiment. (B) Second strand synthesis yields and product sizes. The first-strand cDNA products described above served as template in PCR reactions, the products of which were assessed using a DNA High Sensitivity chip on a Bioanalyzer machine. The colored traces indicate the quantity and size of reaction products generated through use of cycle numbers selected as described above. Note that as cycle number surpassed C(t), product sizes increased (particularly evident at ≥ 1,000 bp).

An official website of the United States government
Here's how you know
Official websites use .gov
A
.gov website belongs to an official
government organization in the United States.
Secure .gov websites use HTTPS
A lock (
) or https:// means you've safely
connected to the .gov website. Share sensitive
information only on official, secure websites.
