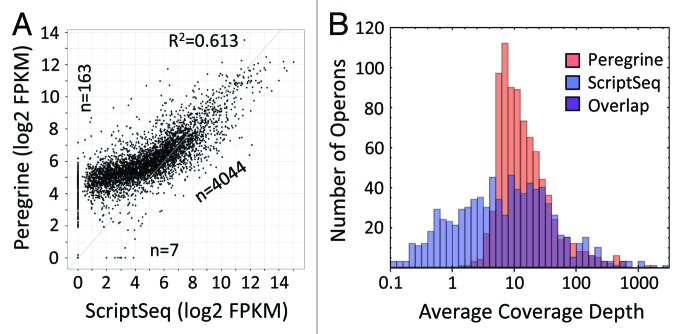
Figure 4.E. coli K-12 operon coverage provided by reads from Peregrine and ScriptSeq libraries. Read statistics for the library sub-samples analyzed are included in Tables S3 and S4. (A) Scatter plot of Log10 of FPKM values for each operon. Points on the axes represent transcripts with zero coverage in one of the two libraries. The number of data points in the diagonal cloud and on the axes is indicated. The coefficient of determination (R2) value, as calculated for all transcripts represented in the libraries, is indicated as well. The coverage levels provided by Peregrine and ScriptSeq libraries are correlated, but ScriptSeq has lower coverage values for low-expression operons and somewhat higher values for high-expression operons. The Spearman rank correlation coefficient between the two methods is 0.819 for operons with mean coverage > 1 in both sets of libraries. (B) Histograms of Log10 of mean coverage levels of operons, with Peregrine in red and ScriptSeq in blue. Mean (standard deviation) of each distribution is 1.16 (0.43) and 0.82 (0.79). Quartile divisions for mean coverage (not Log10) are (7.02128, 11.2367, 22.5935) and (1.67284, 7.17042, 23.0521), indicating a disparity of coverage for low-expression operons that is compensated by high coverage of a small number of high-expression operons.
