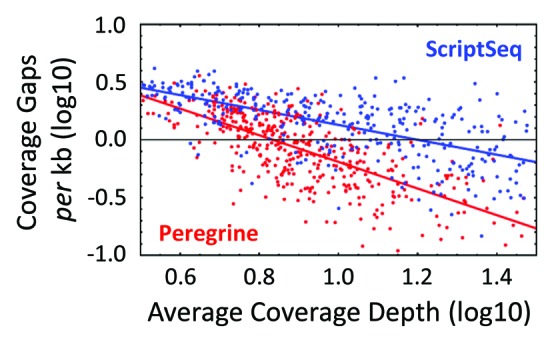
Figure 5. Continuity of transcript coverage in Peregrine and ScriptSeq libraries prepared from E. coli K-12 RNA. Plot of the Log10 number of coverage gaps per kilobase of operon as function of the Log10 coverage depth of the operon. A gap is defined as ≥ five contiguous bases with zero coverage. Linear regression of the gap counts corresponding to coverage values from three to 30 yielded a slope ± standard deviation of -1.15 ± 0.058 and -0.64 ± 0.043 for Peregrine and ScriptSeq, respectively, showing empirically that number of gaps fell twice as fast with increasing coverage for Peregrine libraries. Read statistics for the library sub-samples analyzed are included in Tables S3 and S4.
